Forum Discussion

 Advocate II
How to map latitude longitude
I'm trying to plot latitude longitude on a map in power bi Desktop on a standard map.
In location field I'm unable to add both latitude and longitude. There are also two fields for latitude and longitude but they don't seem to work? Am I doing something wrong, or is it not possible to simply give the map the location to plot.
I can get it working if I use an adresse in the location field, but I'm trying to map positions at sea, so not really useful.
 Anonymous11 years ago
sjkp,
This one is a little counter intuitive. The only map tool that can take straight lat/long is Power Map in Excel, but there currently isn't any integration with the rest of the BI stack yet for that.
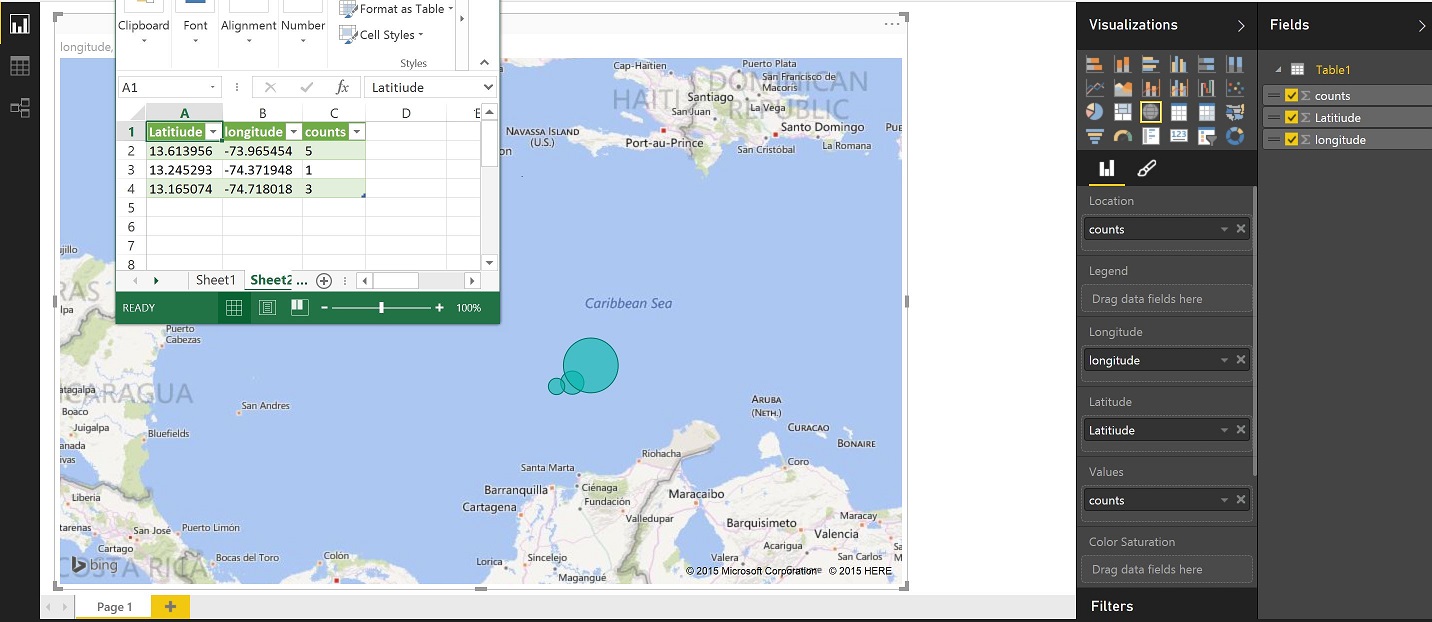
The way you do this in Power View - maps, or the PBI Desktop is put you lat and long in the appropriate Fields, then whatever it is you are examining in that location (count of wrecks, count of "x") that goes in the location and the value fields. Then your bubbles will show up in the middle of the ocean at the coordinates you specified in the lat/long.
If there aren't direct counts, I would assume you can just create a column to contain the value of 1 to make this work.
Here is a screenshot of the sample data I pulled in and the layout in PBI Desktop
30 Replies
- AnonymousNot applicable
sjkp,
This one is a little counter intuitive. The only map tool that can take straight lat/long is Power Map in Excel, but there currently isn't any integration with the rest of the BI stack yet for that.
The way you do this in Power View - maps, or the PBI Desktop is put you lat and long in the appropriate Fields, then whatever it is you are examining in that location (count of wrecks, count of "x") that goes in the location and the value fields. Then your bubbles will show up in the middle of the ocean at the coordinates you specified in the lat/long.
If there aren't direct counts, I would assume you can just create a column to contain the value of 1 to make this work.
Here is a screenshot of the sample data I pulled in and the layout in PBI Desktop
 sjkp
sjkpThanks Eno, I was looking for a solution that works in power bi deskop and preferably powerbi.com (online) or whatever the name for it is. I am aware that it works in power map, but that is not really the tool I want to suggest customers to use going forward.
I hope it's a bug or just a missing feature that it currently is so unintuitive to use. But I will try out your suggestion.
- sjkp
Okay that is pretty **bleep**ed up. If I use a value of 1 for the location, then it will not work, the location value has to be unique. Because if it's not then it will sum all the lat/long together with the same location, which will obviously not give anything meaning full.
- Greg_Deckler
Community Champion
Thanks Eno, your picture helped resolve my problem, I didn't catch that my Latitude and Longitude came in as text instead of decimal in my data model so that's why it wasn't working like I expected/used to in Excel. For some reason, Excel Power Query ingesting from the same data file recognized my values as decimial to begin with but Power BI Desktop did not. Odd.
 John_BNew Member
Thank you for the date type decimal and data category tip
 EmirSvemirNew Member
hey guys,
thanks fo rall the replies, the thread helps a lot. BUT my powerbi is having problem with my Longitude and Latitude, it is changing it automatically to AVERAGE Longitude and latitude when I drag it to their fields.
any solution to this? what do I do wrong? I checked my data set and the fields are marked as decimal numbers but also some fields have written NULL ...could this be the problem?
Thanks a lot in advance! Cheers,
emir
- EmirSvemirNew Member
i changed null to 0, the long and lat are ot anymore changed to average BUT I still have no results.
 gusly
guslyHelper II
I also found this quite confusing, was really hoping it would be more straightforward. Would be good with an example showing how to use latidude and longitude, but I haven't found any official one.
The real problem for me was Power BI Desktop being set to use a locale that uses "," (comma) as decimal separator. Before understanding I could change that setting, I could only achieve proper results by replacing "." with "," as decimal separator (and this wouldn't be a lasting workaround for me as I'm exporting data without that possibility). However, changing the setting saved me, but I didn't find that solution obvious.- residentx
Helper IV
I found a solution but I used the global map. It found all the locations:
Spreadsheet LayoutAccurate Global Mapping
Here's what I did:
1. I did change the numbers to decimal
2. I merged the fields to include city and location.(combined location, clocation)
3. I had two unique columns. One had unique dates. The other had Priority numbers that were unique.
- greggyb
Resident Rockstar
For the two native map types there are different requirements.
A filled map can only take standard location names that define a region with boundaries. This is because there must be something to fill. Lat/Lon coordinates cannot be filled. They are points. How do you fill a point? The same for a full street address, or a street name (a line).
The two-dimensional geographic data types that can be used with the filled map are:
- Postal Code
- City
- County
- State or Province
- Country / Region
- Continent
These must be in a form that can be recognized by Bing maps. The field holding each of these values should have its data category set appropriately in the modelling ribbon menu. One of these fields (or more in a drill-down hierarchy) must be in the Location field well. The area bounded by this geographic data will be shaded based on the value of the measure used in the Values field well.
The Legend field well is optional, but will provide an alternate value in the tool-tip to identify the location. I honestly don't know why Longitude and Latitude are included in the filled map field wells, as I have never been able to use them or see them change the map - this would be interesting to get an explanation from the devs on.The Map visualization can follow the same rules for Location as the Filled Map, but can also take point locations (e.g. street address).
The cool thing about the Map is that it doesn't *need* this geo data in the same way the Filled Map does. You can use Longitude and Latitude (averaged by default - we'll see why this is useful in a minute) to do all of the location plotting.
- The Values field well is similar, except here it determines pie size.
- Location can take any field (that is associated with the Lat/Lon fields we're using). Thus, we can put [StoreName] for example into the Location well, and it will be mapped to the average of Lat/Lon. Now, since we expect just one row in our geography dimension for a [StoreName], we get back exactly the Lat/Lon (average of a single number is that number).
- Location can also take a hierarchy. We could put [StoreRegion] into the Location well and we'd see the region's pie circle at the location that is the average of all [StoreName]s' Lat/Lon coordinates. We could then drill down through [StoreRegion] to [StoreName] and see the child [StoreName]s plotted in their exact location.
- Legend can be used to have an alternate value in the tooltip, or to introduce slices into the pie if each Location value has multiple Legend values associated
- Color Saturation can be an arbitrary measure, whose value will determine the saturation of the individual pies plotted (default is dynamic, but it can be customized with hard-coded limits).
Legend and Color Saturation cannot be utilized together.
- Greg_Deckler
Can you provide an example of the format you are using for latitude and longitude? Should be like:
Text,Latitude,Longitude
Thing1,-37.8136,144.9631That is Melbourne Australia
In your data model, click on the column for Latitude and set the "Data category" to "Latitude". Do the same for Longitude. This is on the Modeling tab.
The way this is *supposed* to work is that in the map visualization you put your text identifier as the Location, you put your Longitude and Latitude into their appropriate fields and voila, you have your map. This works perfectly in Excel Power View. Note in Excel, the data cateogorization and on the "Advanced" tab.
Not so much in Power BI Desktop, it wants to put "Count of Longitude" and "Count of Latitude" into the Longitude and Latitude fields even though I have them categorized correctly. I'd say it's a bug personally. Interestingly, in the "Location" field suggestions it says that it can either be named location or latitude and longitude coordinates, but it doesn't allow you to drag two fields in that and I haven't found a combination of longitude and latitude that I can drag into that field to make it do anything useful.
- AnonymousNot applicable
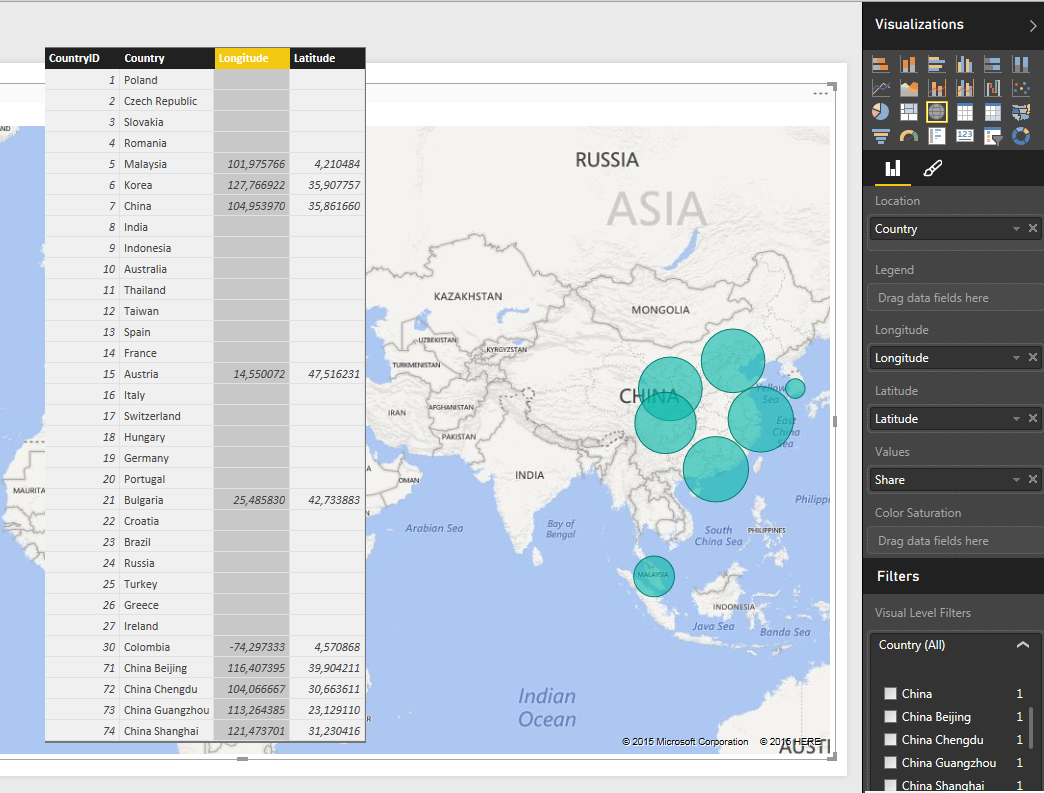
In addition to the hints I found here concerning setting data category to Longitude / Latitude and data format to decimal I got the expected picture when I set "Default Summarization" of Longitude and Latitude to "Maximum" (Take "Minimum" if you want, it does not matter as long as the summarization delivers the Longitude/Latitude values themselves - An "Only" function like in QlikView would be the correct choice for this purpose here)
In the location field of the map tool, I entered "Country" which does the trick. It does it before without Longitude/Latitude but I needed 5 seperate Regions in China, which I did noct achieve before. I have 5 different entries for them in "Countries" as well, so I think it's the combination of unique combinations of Country/Longitude/Latitude that makes it work.
- PoolR
Advocate I
I've encountered the same issue.
There is however a workaround. Add a column that concenates the latitude and longtitude values, together with a comma, eg: Location = [Latitude]&", "& [Longitude]. Map that column to the location field and don't mind using the latitude and longtitude field. That should do the trick.
Regards,
Richard van der Pool
- Jamie1Regular Visitor
Thank you Richard - this worked perfectly. Why we even need such a workaround is something of a mystery - would it not be one of the first things you'd test with a mapping visual?