Forum Discussion

 Advocate II
How to map latitude longitude
 Anonymous11 years ago
sjkp,
This one is a little counter intuitive. The only map tool that can take straight lat/long is Power Map in Excel, but there currently isn't any integration with the rest of the BI stack yet for that.
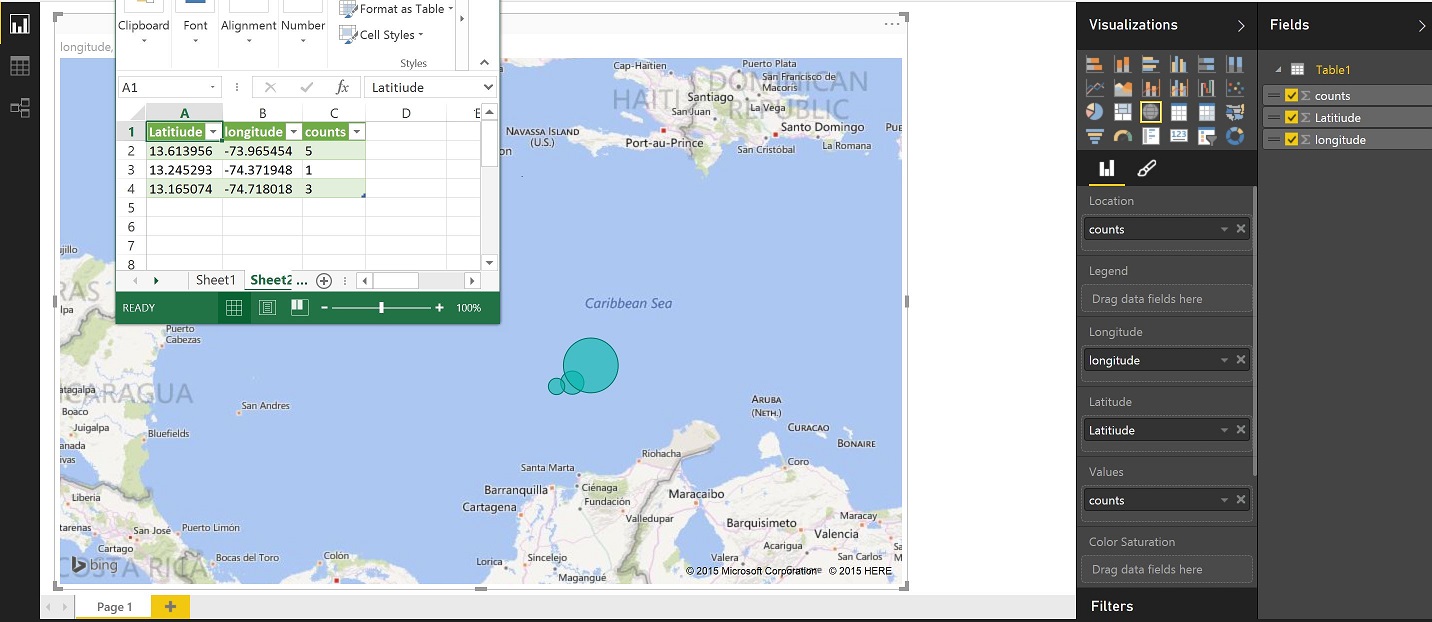
The way you do this in Power View - maps, or the PBI Desktop is put you lat and long in the appropriate Fields, then whatever it is you are examining in that location (count of wrecks, count of "x") that goes in the location and the value fields. Then your bubbles will show up in the middle of the ocean at the coordinates you specified in the lat/long.
If there aren't direct counts, I would assume you can just create a column to contain the value of 1 to make this work.
Here is a screenshot of the sample data I pulled in and the layout in PBI Desktop

 Helper IV
I found a solution but I used the global map. It found all the locations:
Spreadsheet LayoutAccurate Global Mapping
Here's what I did:
1. I did change the numbers to decimal
2. I merged the fields to include city and location.(combined location, clocation)
3. I had two unique columns. One had unique dates. The other had Priority numbers that were unique.

 Resident Rockstar
For the two native map types there are different requirements.
A filled map can only take standard location names that define a region with boundaries. This is because there must be something to fill. Lat/Lon coordinates cannot be filled. They are points. How do you fill a point? The same for a full street address, or a street name (a line).
The two-dimensional geographic data types that can be used with the filled map are:
- Postal Code
- City
- County
- State or Province
- Country / Region
- Continent
These must be in a form that can be recognized by Bing maps. The field holding each of these values should have its data category set appropriately in the modelling ribbon menu. One of these fields (or more in a drill-down hierarchy) must be in the Location field well. The area bounded by this geographic data will be shaded based on the value of the measure used in the Values field well.
The Legend field well is optional, but will provide an alternate value in the tool-tip to identify the location. I honestly don't know why Longitude and Latitude are included in the filled map field wells, as I have never been able to use them or see them change the map - this would be interesting to get an explanation from the devs on.
The Map visualization can follow the same rules for Location as the Filled Map, but can also take point locations (e.g. street address).
The cool thing about the Map is that it doesn't *need* this geo data in the same way the Filled Map does. You can use Longitude and Latitude (averaged by default - we'll see why this is useful in a minute) to do all of the location plotting.
- The Values field well is similar, except here it determines pie size.
- Location can take any field (that is associated with the Lat/Lon fields we're using). Thus, we can put [StoreName] for example into the Location well, and it will be mapped to the average of Lat/Lon. Now, since we expect just one row in our geography dimension for a [StoreName], we get back exactly the Lat/Lon (average of a single number is that number).
- Location can also take a hierarchy. We could put [StoreRegion] into the Location well and we'd see the region's pie circle at the location that is the average of all [StoreName]s' Lat/Lon coordinates. We could then drill down through [StoreRegion] to [StoreName] and see the child [StoreName]s plotted in their exact location.
- Legend can be used to have an alternate value in the tooltip, or to introduce slices into the pie if each Location value has multiple Legend values associated
- Color Saturation can be an arbitrary measure, whose value will determine the saturation of the individual pies plotted (default is dynamic, but it can be customized with hard-coded limits).
Legend and Color Saturation cannot be utilized together.
- residentx10 years ago
Thanks for the tips, Greggyb. In regards to county, I had to use "Howard County, MD" [County, State] or my data was off.
Also, do you know why it bubbles instead of filling in the county borders? EDIT: I got it. I used the regular MAP but "filled" is the border one.
Mapping by County
Filled Map by Zipcode
- residentx10 years ago
I couldn't pull up any city in Howard or Carroll County, Maryland though...weird! I'll open tickets with Bing Maps.
- residentx10 years ago
Ukraine I got done. I could do "city" filled map and a regular map. I put in the administrative centres and color coded the oblasts!
Capitals with color coded Oblasts
Filled Map by Cities
- Anonymous9 years agoNot applicable
Thank you, this helped me to figure out why my maps wouldn't work! My maps are now working and I'm using post code with Filled Map and Long/Lat with the globe Map.