Forum Discussion

Anonymous's avatar
Anonymous
Not applicable
5 years ago
Solved

How to dynamically compare values for different records in Power BI?

Hi all, 


Hope everyone is safe and sound.


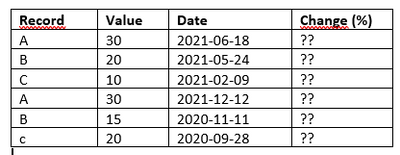
I have a list of records  which value is periodically measured and I need to calculate how much that value has changed for each record after the latest evaluation - to show in percentages whether the value has increased or decreased.


Could someone please advice what would be the correct way to accomplish this? Would sincerely appreciate any advice. 

  • Anonymous 

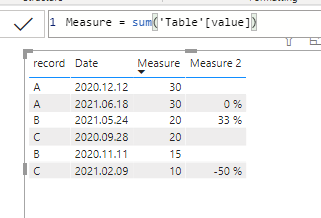
    update the pbix file. you can create either a column or a measure for that

    please see the attachment below

5 Replies

  • Anonymous 

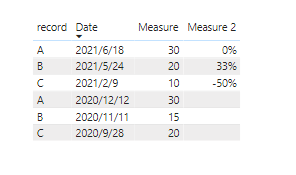
    is this what you want?

    Measure 2 = 
    var last=maxx(FILTER(all('Table'),'Table'[record]=max('Table'[record])&&'Table'[Date]<max('Table'[Date])),'Table'[Date])
    var lastvalue=CALCULATE([Measure],FILTER(all('Table'),'Table'[record]=MAX('Table'[record])&&'Table'[Date]=last))
    return DIVIDE([Measure]-lastvalue,lastvalue)

    please see the attachment below

    • Anonymous's avatar
      Anonymous
      Not applicable

      Hi, ryan_mayu . Many thanks for this. I am trying to reproduce it on my end.  Still find a bit difficult.


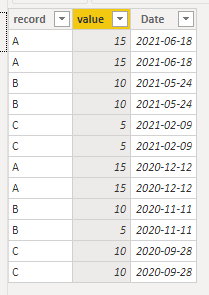
      May I ask, why does record has value 15 twice on same date (2021-06-18) instead of 30? I am not able to modify my original data set to make it as your example.

      Therefore, I am not able to add the measure to the table the same way you did. 


      • ryan_mayu's avatar
        ryan_mayu
        Icon for Super User rankSuper User

        Anonymous 

        update the pbix file. you can create either a column or a measure for that

        please see the attachment below