FabCon is coming to Atlanta
Join us at FabCon Atlanta from March 16 - 20, 2026, for the ultimate Fabric, Power BI, AI and SQL community-led event. Save $200 with code FABCOMM.
Register now!- Power BI forums
- Get Help with Power BI
- Desktop
- Service
- Report Server
- Power Query
- Mobile Apps
- Developer
- DAX Commands and Tips
- Custom Visuals Development Discussion
- Health and Life Sciences
- Power BI Spanish forums
- Translated Spanish Desktop
- Training and Consulting
- Instructor Led Training
- Dashboard in a Day for Women, by Women
- Galleries
- Data Stories Gallery
- Themes Gallery
- Contests Gallery
- Quick Measures Gallery
- Notebook Gallery
- Translytical Task Flow Gallery
- TMDL Gallery
- R Script Showcase
- Webinars and Video Gallery
- Ideas
- Custom Visuals Ideas (read-only)
- Issues
- Issues
- Events
- Upcoming Events
Calling all Data Engineers! Fabric Data Engineer (Exam DP-700) live sessions are back! Starting October 16th. Sign up.
- Power BI forums
- Forums
- Get Help with Power BI
- Desktop
- How to display Text values on Bar chart?
- Subscribe to RSS Feed
- Mark Topic as New
- Mark Topic as Read
- Float this Topic for Current User
- Bookmark
- Subscribe
- Printer Friendly Page

- Mark as New
- Bookmark
- Subscribe
- Mute
- Subscribe to RSS Feed
- Permalink
- Report Inappropriate Content
How to display Text values on Bar chart?
Hi Power BI Team,
I've below data.
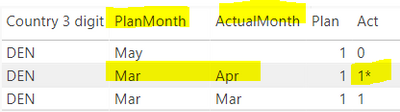
Here the our requirement is to compare PlanMonth Vs Actual Month,
1. If PlanMonth & ActualMonth are same then show Plan as 1, Act as 1.
2. if PlanMonth < ActualMonth then Plan as 1, Act as 1*.
3. if PlanMonth/ActualMonth is missing then 0.
I have created the Plan and Act new columns by using if condtions as above.
Note:- Plan data type is (Whole Number)
Act data type is (Text) because 1* can't be a Whole Number format. (Refer Image below)

My requirement is to show the data in "Bar chart" but it looks like we can't use Text datatype columns as "Values".
How to show this 1* in the bar chart?
Business Use Case:
They wanted to see the differentiation between Plan Month and Actual Month. It means How may they have planned and when it is actually happened.
Any help on this would be highly appreciated. Thanks!
Solved! Go to Solution.


- Mark as New
- Bookmark
- Subscribe
- Mute
- Subscribe to RSS Feed
- Permalink
- Report Inappropriate Content
Hi, @Anonymous
As far as I know, this is impossible to achieve, the value has its own value attribute.
The bar graph itself cannot display text. The reason why I suggest you change your judgment condition to -1 is to keep the attribute of the value. The reason why it is -1 instead of 1 is because the custom formatting acts on positive, negative and zero values. Use -1 to distinguish it from the other two cases (1, 0).
According to your expectations, 1 and 1* are on the same horizontal line, which means that the value of 1* is 1. This cannot distinguish 1 from another 1. This is the purpose of -1. Once -1 is used, there are positive and negative axes, which cannot be avoided. Although the final result has a positive and negative axis, it better shows the actMonth.
Glad to see different solutions.
Best Regards,
Community Support Team _ Zeon Zheng
If this post helps, then please consider Accept it as the solution to help the other members find it more quickly.


- Mark as New
- Bookmark
- Subscribe
- Mute
- Subscribe to RSS Feed
- Permalink
- Report Inappropriate Content
Hi @Anonymous ,
are you familiar with the External Tool Tabular Editor?
You need to download and install it first.
https://github.com/TabularEditor/TabularEditor/releases/tag/2.16.1
After the installation, you can start it from the menu bar.
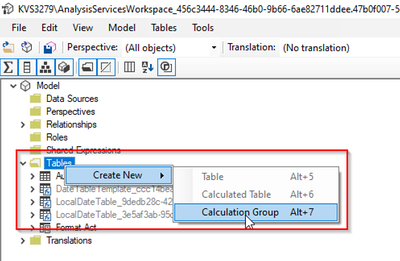
Here you can create a Calculation Group (Table).

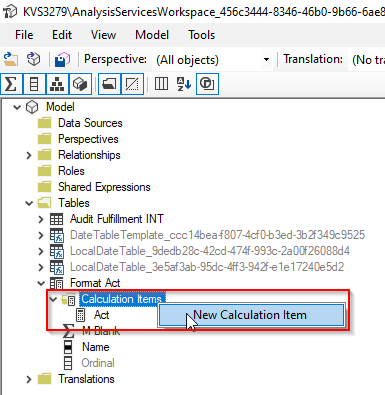
Here you create a Calculation Item.
Define the "Expression"
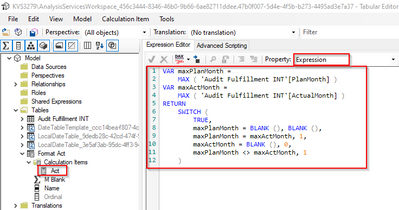
Define the "Format String Expression" and save the change
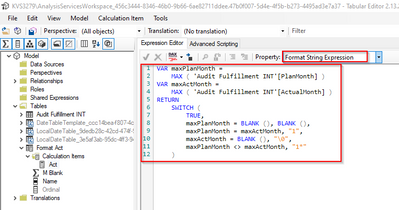
This solution is not yet optimal but a kind of proof of concept.
Please mark my post as solution, this will also help others.
Please give Kudos for support.
Marcus Wegener works as Full Stack Power BI Engineer at BI or DIE.
His mission is clear: "Get the most out of data, with Power BI."
twitter - LinkedIn - YouTube - website - podcast - Power BI Tutorials
- Mark as New
- Bookmark
- Subscribe
- Mute
- Subscribe to RSS Feed
- Permalink
- Report Inappropriate Content
Hi @Anonymous ,
attached you will find my solution.
But for this you have to trick with the TabularEditor and the calculation groups.

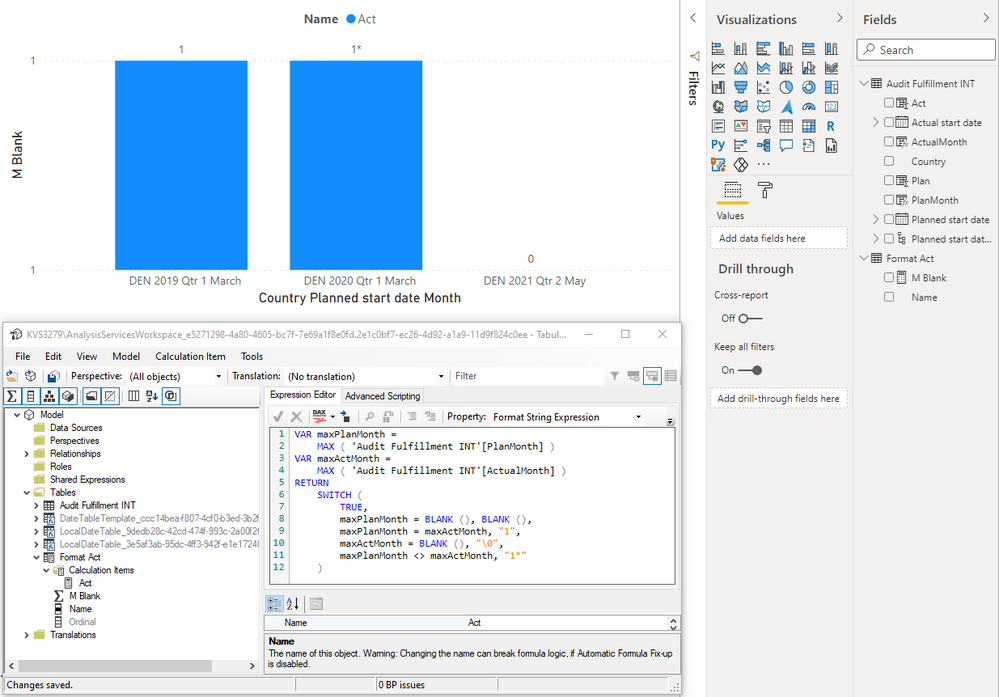
Please mark my post as solution, this will also help others.
Please give Kudos for support.
Marcus Wegener works as Full Stack Power BI Engineer at BI or DIE.
His mission is clear: "Get the most out of data, with Power BI."
twitter - LinkedIn - YouTube - website - podcast - Power BI Tutorials
- Mark as New
- Bookmark
- Subscribe
- Mute
- Subscribe to RSS Feed
- Permalink
- Report Inappropriate Content
Hi,
I'm surprised to see this visual.
How did you write this M Blank? how is this fetching respective values from original table Act values? I see there is no relationship with these tables as well. Please need more info on this. Thanks!
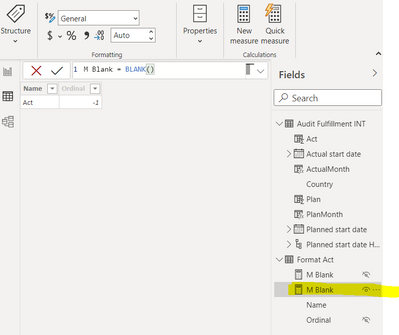
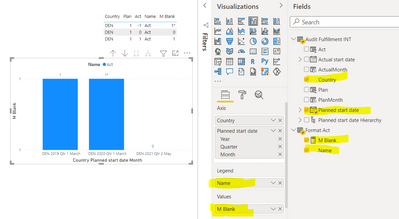
- Mark as New
- Bookmark
- Subscribe
- Mute
- Subscribe to RSS Feed
- Permalink
- Report Inappropriate Content
Hi @Anonymous ,
are you familiar with the External Tool Tabular Editor?
You need to download and install it first.
https://github.com/TabularEditor/TabularEditor/releases/tag/2.16.1
After the installation, you can start it from the menu bar.
Here you can create a Calculation Group (Table).
Here you create a Calculation Item.
Define the "Expression"
Define the "Format String Expression" and save the change
This solution is not yet optimal but a kind of proof of concept.
Please mark my post as solution, this will also help others.
Please give Kudos for support.
Marcus Wegener works as Full Stack Power BI Engineer at BI or DIE.
His mission is clear: "Get the most out of data, with Power BI."
twitter - LinkedIn - YouTube - website - podcast - Power BI Tutorials
- Mark as New
- Bookmark
- Subscribe
- Mute
- Subscribe to RSS Feed
- Permalink
- Report Inappropriate Content
Hi Mwegner,
Thanks for the kind reply so far!
Actually I achieved Act & Plan bars as per your instructions.
Only two things to be resolved.
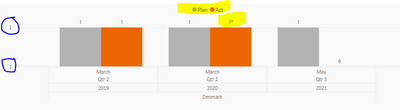
1. I'm getting Y-Axis scale has 1 and 1 instead 0,1,2...... As shown below.
2. I've a Italy data as below. and if you see 02 Plan records in June Month.

According the above screenshot expecting the below as output:
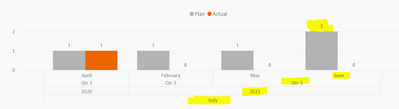
But at present I'm getting as below:
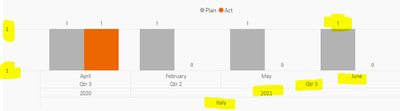
Looks like some where we need use Count Aggregation. I did see you used Max function.
I highly appreciated so far and I'm really looking forward to fix this. Thanks
- Mark as New
- Bookmark
- Subscribe
- Mute
- Subscribe to RSS Feed
- Permalink
- Report Inappropriate Content
Hi @Anonymous ,
I have adjusted the Format String Expression for the Y-Axis.
VAR maxPlanMonth =
    MAX ( 'Audit Fulfillment INT'[PlanMonth] )
VAR maxActMonth =
    MAX ( 'Audit Fulfillment INT'[ActualMonth] )
RETURN
    SWITCH (
        TRUE,
        maxActMonth = BLANK (), "0",
        maxPlanMonth <> maxActMonth, "0*",
        "0"
    )
How should the counting be done if the rows would have to be formatted differently?
Please mark my post as solution, this will also help others.
Please give Kudos for support.
Marcus Wegener works as Full Stack Power BI Engineer at BI or DIE.
His mission is clear: "Get the most out of data, with Power BI."
twitter - LinkedIn - YouTube - website - podcast - Power BI Tutorials
- Mark as New
- Bookmark
- Subscribe
- Mute
- Subscribe to RSS Feed
- Permalink
- Report Inappropriate Content
Hi @Anonymous ,
How should the values be displayed in the bar chart?
Only as 0 , 1 and 1*?
Should the bar of 1 and 1* be the same length?
Please mark my post as solution, this will also help others.
Please give Kudos for support.
Marcus Wegener works as Full Stack Power BI Engineer at BI or DIE.
His mission is clear: "Get the most out of data, with Power BI."
twitter - LinkedIn - YouTube - website - podcast - Power BI Tutorials
- Mark as New
- Bookmark
- Subscribe
- Mute
- Subscribe to RSS Feed
- Permalink
- Report Inappropriate Content
Hi,
Yes, 1 & 1* should be the same length.
Is it possible to show these values on bar chart? Please let me know thansk!
- Mark as New
- Bookmark
- Subscribe
- Mute
- Subscribe to RSS Feed
- Permalink
- Report Inappropriate Content
Hi, @Anonymous
Do I have to use 1* text? Can I use -1 instead? so the answer is much simpler.
The use of text values in bar charts is not allowed. But if you format -1 as a text 1*, it can be done.
So change the result of the condition:
if PlanMonth < ActualMonth then Plan as 1, Act as -1
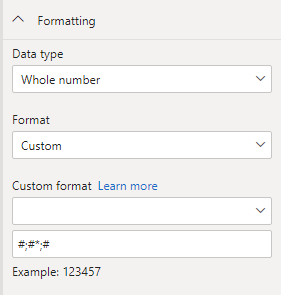
Then use custom conditional formatting in the model like below:
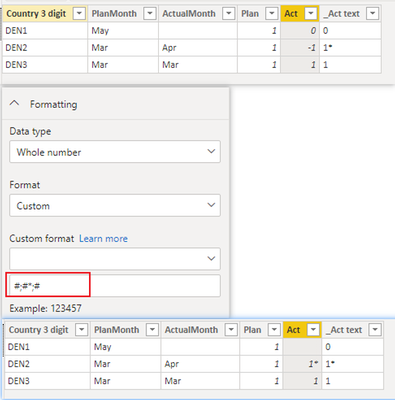
Finally, invert the x-axis to beautify the bar chart
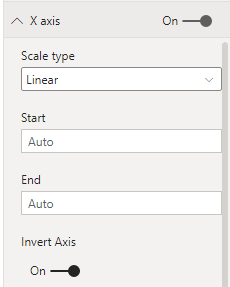
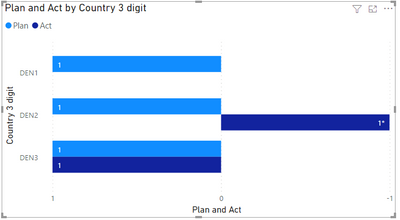
Hope this helps.
Best Regards,
Community Support Team _ Zeon Zheng
If this post helps, then please consider Accept it as the solution to help the other members find it more quickly.
- Mark as New
- Bookmark
- Subscribe
- Mute
- Subscribe to RSS Feed
- Permalink
- Report Inappropriate Content
Hi,
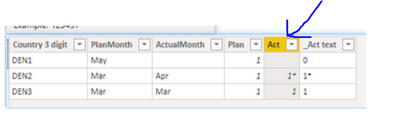
I did follow your method but I get * for every value. Please see the below image.

The below your screen Act column is exactly our requirement. but I am not getting it. Need more help on this. Thanks!
- Mark as New
- Bookmark
- Subscribe
- Mute
- Subscribe to RSS Feed
- Permalink
- Report Inappropriate Content
Hi, @Anonymous
Please note the use of semicolons instead of commas.
(';'not ',') >>>Format string: #;#*;#
See the links below for more information:
https://docs.microsoft.com/en-us/power-bi/create-reports/desktop-custom-format-strings
https://docs.microsoft.com/en-us/dax/format-function-dax
Please refer to the attachment below for details
Best Regards,
Community Support Team _ Zeon Zheng
If this post helps, then please consider Accept it as the solution to help the other members find it more quickly.
- Mark as New
- Bookmark
- Subscribe
- Mute
- Subscribe to RSS Feed
- Permalink
- Report Inappropriate Content
Hi @Anonymous ,
can you share a screenshot of your format string?
With Calculation Groups you can have even more control over the format. Check it out:
https://www.esbrina-ba.com/time-intelligence-dynamic-legend-in-line-charts/
Please mark my post as solution, this will also help others.
Please give Kudos for support.
Marcus Wegener works as Full Stack Power BI Engineer at BI or DIE.
His mission is clear: "Get the most out of data, with Power BI."
twitter - LinkedIn - YouTube - website - podcast - Power BI Tutorials
- Mark as New
- Bookmark
- Subscribe
- Mute
- Subscribe to RSS Feed
- Permalink
- Report Inappropriate Content
Hi,
Here is my app and I've shared my Current senario with example.
https://drive.google.com/file/d/1kD9wRLS0qS7C80RUtUwXWCLetJ0TFe1s/view?usp=sharing
I would like to show my negative values as positive in my chart with someother format like 1* or (1) , etc....
Just the use case is I just wanted to tell the user like "Actual" happened is not in the same month that is it.
Thanks for you help so far. !
- Mark as New
- Bookmark
- Subscribe
- Mute
- Subscribe to RSS Feed
- Permalink
- Report Inappropriate Content
Hi, @Anonymous
I've used the above method in your sample, check the attachment for details
result:
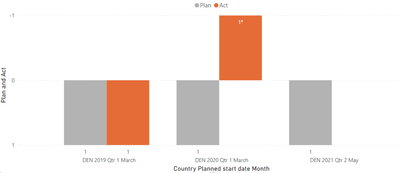
Hope this helps.
Best Regards,
Community Support Team _ Zeon Zheng
If this post helps, then please consider Accept it as the solution to help the other members find it more quickly.
- Mark as New
- Bookmark
- Subscribe
- Mute
- Subscribe to RSS Feed
- Permalink
- Report Inappropriate Content
Hi,
Thanks for your prompt reply!
I wanted to show negative values as positive values with different format values (1* or (1) ). The below is my expectations If Plan and Act months are different then I want to display like below Example shown for March Month:
Note: Plan Date is my Dimension.
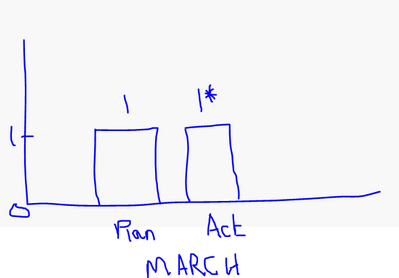
- Mark as New
- Bookmark
- Subscribe
- Mute
- Subscribe to RSS Feed
- Permalink
- Report Inappropriate Content
Hi, @Anonymous
As far as I know, this is impossible to achieve, the value has its own value attribute.
The bar graph itself cannot display text. The reason why I suggest you change your judgment condition to -1 is to keep the attribute of the value. The reason why it is -1 instead of 1 is because the custom formatting acts on positive, negative and zero values. Use -1 to distinguish it from the other two cases (1, 0).
According to your expectations, 1 and 1* are on the same horizontal line, which means that the value of 1* is 1. This cannot distinguish 1 from another 1. This is the purpose of -1. Once -1 is used, there are positive and negative axes, which cannot be avoided. Although the final result has a positive and negative axis, it better shows the actMonth.
Glad to see different solutions.
Best Regards,
Community Support Team _ Zeon Zheng
If this post helps, then please consider Accept it as the solution to help the other members find it more quickly.
- Mark as New
- Bookmark
- Subscribe
- Mute
- Subscribe to RSS Feed
- Permalink
- Report Inappropriate Content
Thank you for your support so far.
If there is no way then I'll stop here and show the display the Negative values only. Thanks!
Helpful resources

FabCon Global Hackathon
Join the Fabric FabCon Global Hackathon—running virtually through Nov 3. Open to all skill levels. $10,000 in prizes!

FabCon Atlanta 2026
Join us at FabCon Atlanta, March 16-20, for the ultimate Fabric, Power BI, AI and SQL community-led event. Save $200 with code FABCOMM.


