Forum Discussion

How do I suppress blank line data?
Hi,
I have a master data table and another filtered list table, joined with the master data table. As the master data table has some values that are not there in the filtered list table, the remaining items are aggregated as (Blank) in the visualisation. Any idea how do I get these Blank rows suppressed or ignored in the visualisation? FYI, the filtered list table is a specific hierarchy that I would like to use in drill down whereas master data, as the name sounds, has other records as well. Thx
 Anonymous10 years ago
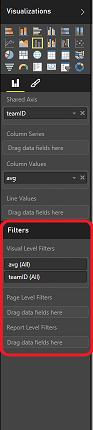
shehzad you have 3 options to do this on the visualization page. You can filter them out in the specific visual "Visual Level Filters", the report page "Page Level Filters" or on the entire report "Report Level Filters"
Just drag your field that you want filtered into one of those areas, and only select the options you want, or do an advanced filter and exclude the blank.
4 Replies
- AnonymousNot applicable
shehzad you have 3 options to do this on the visualization page. You can filter them out in the specific visual "Visual Level Filters", the report page "Page Level Filters" or on the entire report "Report Level Filters"
Just drag your field that you want filtered into one of those areas, and only select the options you want, or do an advanced filter and exclude the blank.
- AnonymousNot applicable
If you have a row with multiple measures, simply checking for one measure may not suffice.
e.g. If you have MeasureA and MeasureB as values in a Matrix and want to hide lines ONLY WHEN both MeasureA and MeasureB are blank, doing what was suggested (i.e. going to the Visual level filters and setting MeasureA is not blank) may filter out the values in MeasureB. The best way to get around it is to create another measure that may look like this.
IsBlankRowMeasure = IF(ISBLANK(MeasureA) && ISBLANK(MeasureB), 1, 0)
In this case, only when both MeasureA and MeasureB are blanks, is the values if IsBlankRowMeasure = 1. Then you can filter out where value of IsBlankRowMeasure = 1.
 deepvibha
Advocate II
Hello,
I am plotting various surgeries performed by doctors for a day.
However, if I apply a filter to suppress Zero values of all surgery, the chart goes blank.
I wish to display the visualization for >0 surgeries for all doctors for the day.
How do I achieve it?
Thanks.
 akruzel
Kudo Collector
I was asking the same question and ran across this. This solution appears to work but breaks when I have a hierarchy in the Shared Axis. I'm using the Visual Filter to remove blanks for a measure and everything works fine until I put that 2nd level so I can drill down. The error i get is :
Data Shape Query translation failed with error code: 'ContextFilterOnlyAllowsScopeFilterInContextDataShape'. Check report server logs for more information.
Anyone have any thoughts? Can we just remove these blank values with DAX language?