FabCon is coming to Atlanta
Join us at FabCon Atlanta from March 16 - 20, 2026, for the ultimate Fabric, Power BI, AI and SQL community-led event. Save $200 with code FABCOMM.
Register now!- Power BI forums
- Get Help with Power BI
- Desktop
- Service
- Report Server
- Power Query
- Mobile Apps
- Developer
- DAX Commands and Tips
- Custom Visuals Development Discussion
- Health and Life Sciences
- Power BI Spanish forums
- Translated Spanish Desktop
- Training and Consulting
- Instructor Led Training
- Dashboard in a Day for Women, by Women
- Galleries
- Data Stories Gallery
- Themes Gallery
- Contests Gallery
- Quick Measures Gallery
- Visual Calculations Gallery
- Notebook Gallery
- Translytical Task Flow Gallery
- TMDL Gallery
- R Script Showcase
- Webinars and Video Gallery
- Ideas
- Custom Visuals Ideas (read-only)
- Issues
- Issues
- Events
- Upcoming Events
Calling all Data Engineers! Fabric Data Engineer (Exam DP-700) live sessions are back! Starting October 16th. Sign up.
- Power BI forums
- Forums
- Get Help with Power BI
- Desktop
- Re: Getting ridiculously wrong subtotals in matrix...
- Subscribe to RSS Feed
- Mark Topic as New
- Mark Topic as Read
- Float this Topic for Current User
- Bookmark
- Subscribe
- Printer Friendly Page


- Mark as New
- Bookmark
- Subscribe
- Mute
- Subscribe to RSS Feed
- Permalink
- Report Inappropriate Content
Getting ridiculously wrong subtotals in matrix visual
I am trying to build a visual with three rows and no columns. When I add a couple of values that I am bringing in from a data set, the subtotals are either correct for one or the other, not both:
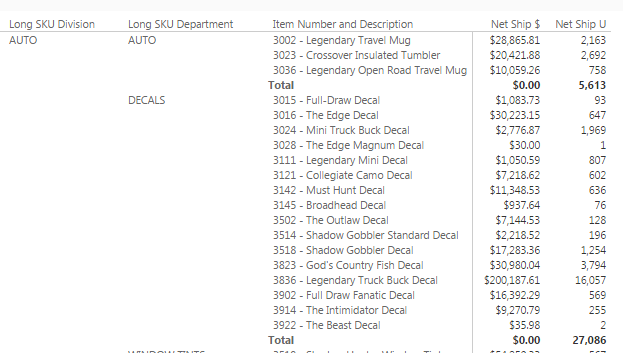
Above, Net Shipped Units subtotal correctly
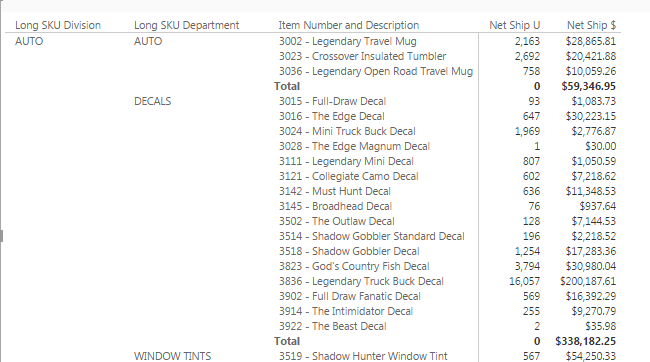
Above, Net Shipped Dollars subtotal correctly.
It appears whichever column I add latest has the correct subtotal. Both of these metrics are coming straight from my fact table - there are no calculations done on them from inside of Power BI, aside from the option to sum them within the matrix visual.
However, I next try to add a custom metric, and now I get a number that is even more wrong than 0:
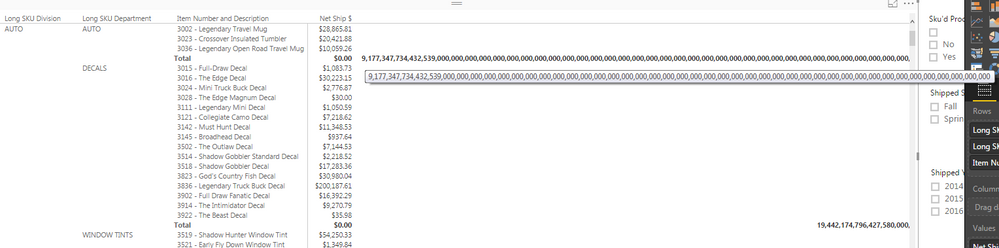
The calculation for the custom metric is pretty basic:
Net Ship GM% = DIVIDE(SUM(Demand[Ship $]) - SUM(Demand[COGS]),sum(Demand[Net Ship $]))
What am I doing that is causing these subtotals to aggregate incorrectly?
Thank you


- Mark as New
- Bookmark
- Subscribe
- Mute
- Subscribe to RSS Feed
- Permalink
- Report Inappropriate Content
As highlighted in yellow, returning the 0 is weird. Please check your data type and create again if it still has the issue. Essentially, it will return the total sum of all Net Ship in AUTO.
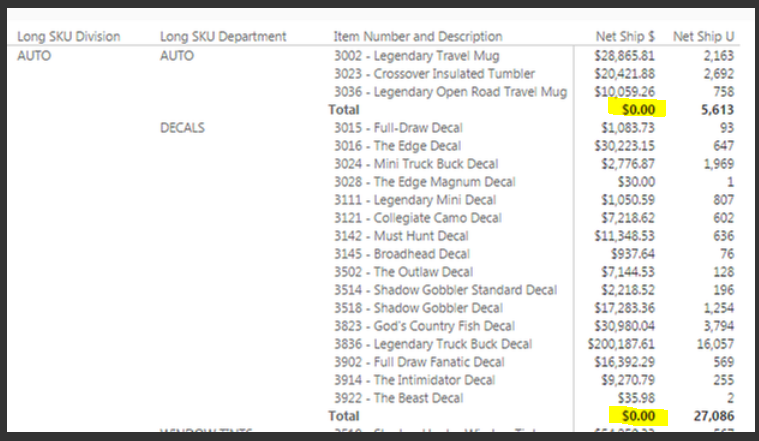
I try to reproduce your scenario using the follow sample data.
Then, I create below measure, and get expected result without issue.
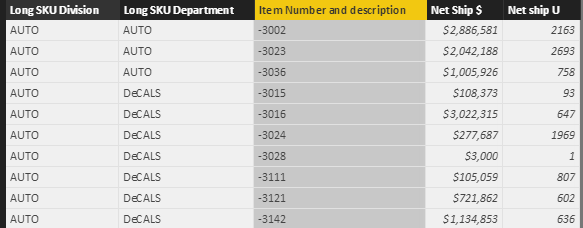
Net Ship GM% = DIVIDE(SUM(Test[Net Ship $]),SUM(Test[Net ship U]))
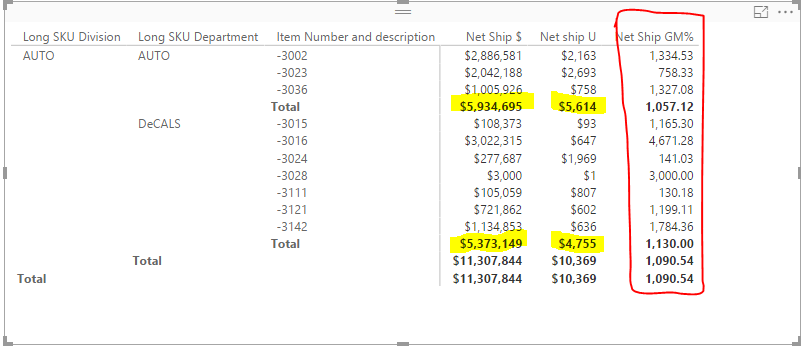
For you issue, what are “Ship” and “COGS” columns in the custom metric? If there is a logical error, could you please share the sample date or screenshot for further analysis?
Best Regards,
Angelia
- Mark as New
- Bookmark
- Subscribe
- Mute
- Subscribe to RSS Feed
- Permalink
- Report Inappropriate Content
I have rebuilt this visual with a new pbix file and found I could replicate it by adding a filter on Net Ship U is greater than 0. I had put this filter in my original matrix because without it I am seeing all products in my Product Dimension table, whether or not they had any sales associated with them. @v-huizhn-msft, when you put a filter on your Net Ship U in the Visual's filters does that allow you to replicate my strange results?
- Mark as New
- Bookmark
- Subscribe
- Mute
- Subscribe to RSS Feed
- Permalink
- Report Inappropriate Content
I should have added that these rows without values only show up when I added a custom metric to the table:
Item Rank NC$ = RANKX(ALL('Product'[Item Number and Description]),Demand[Total NC$],,DESC)This is a metric that ranks the items in the matrix by Net Contribution Dollars.
- Mark as New
- Bookmark
- Subscribe
- Mute
- Subscribe to RSS Feed
- Permalink
- Report Inappropriate Content
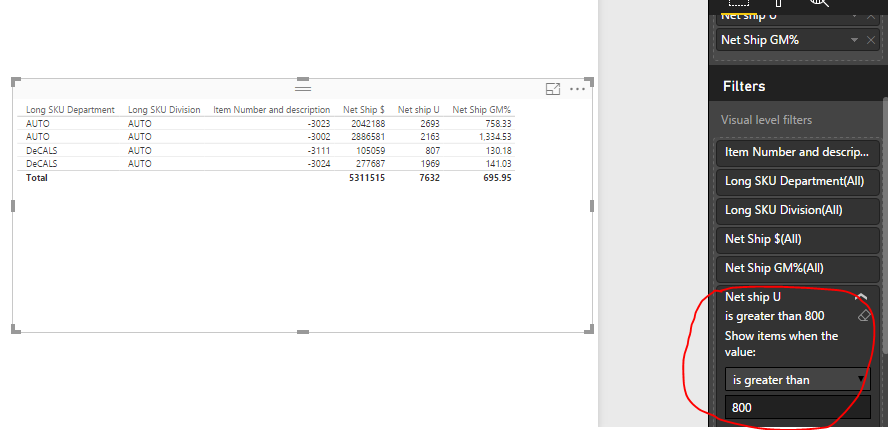
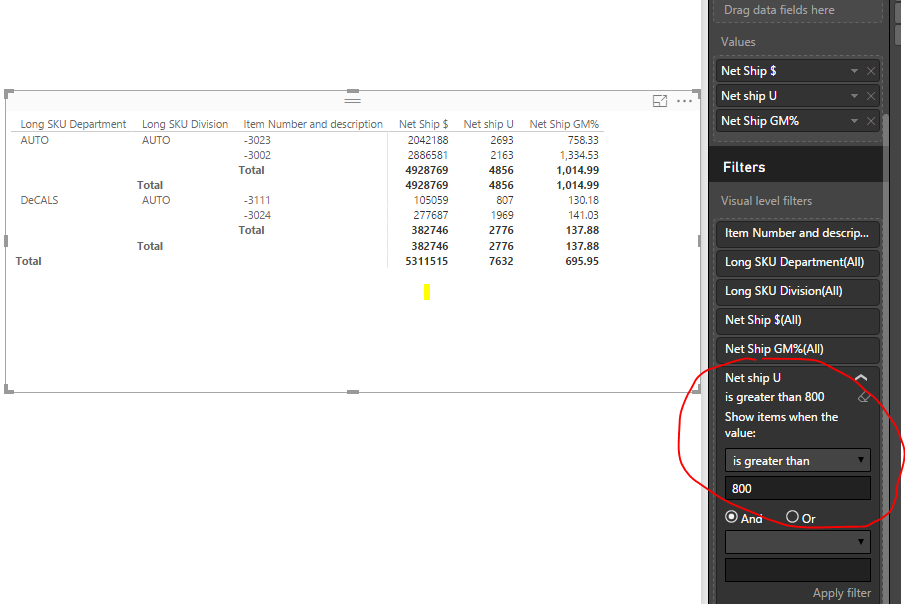
@Dave_Gugg I put Net Ship U in the Visual's filters, it return the expected result without any issue. Please review the below screenshot.
Best Regars,
Angelia
- Mark as New
- Bookmark
- Subscribe
- Mute
- Subscribe to RSS Feed
- Permalink
- Report Inappropriate Content
@v-huizhn-msft, are you using the table or matrix for your test? I am using the matrix.
- Mark as New
- Bookmark
- Subscribe
- Mute
- Subscribe to RSS Feed
- Permalink
- Report Inappropriate Content
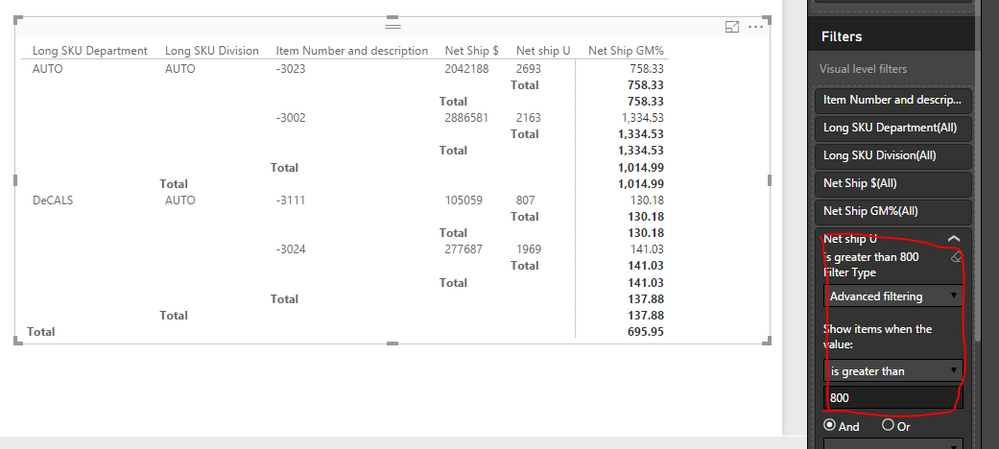
@Dave_Gugg Sorry for inconvience, I reproduce it using Metrix and it works fine, please review below screenshot.
Best Regards,
Angelia
- Mark as New
- Bookmark
- Subscribe
- Mute
- Subscribe to RSS Feed
- Permalink
- Report Inappropriate Content
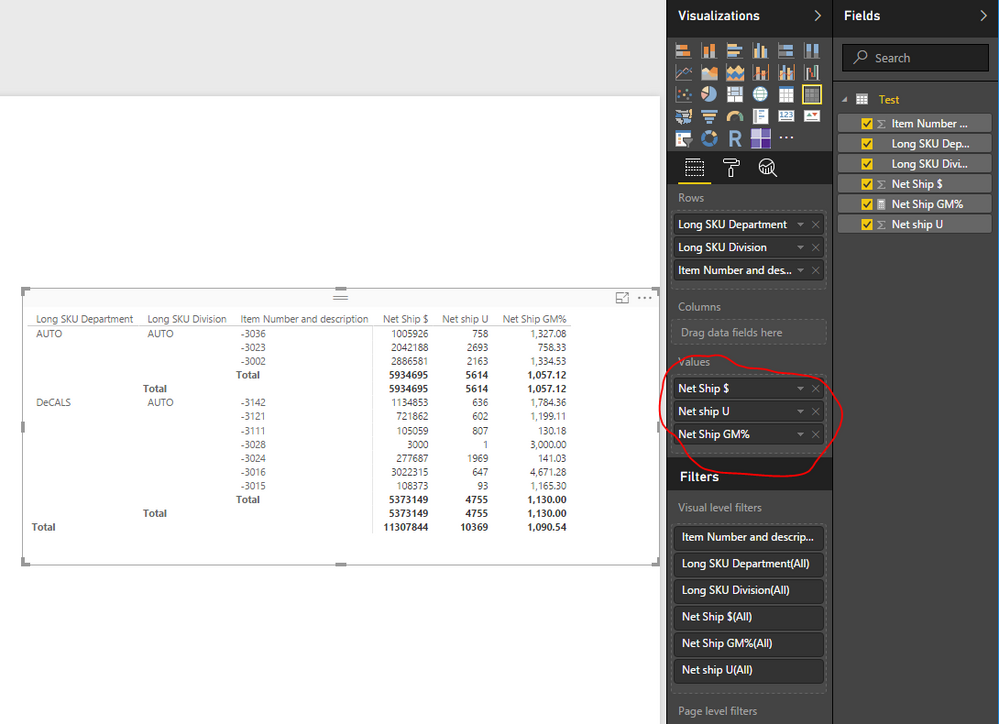
@v-huizhn-msft, thank you for sticking with this. The Net Ship $ and Net ship U need to be in the Values section, not the Rows section.
- Mark as New
- Bookmark
- Subscribe
- Mute
- Subscribe to RSS Feed
- Permalink
- Report Inappropriate Content
@Dave_Gugg I am very gald to help you. The Net Ship $ and Net ship U are placed in the Values section. Please the below screenshot.
If you have any question, please feel free to ask.
Best Regards,
Angelia
- Mark as New
- Bookmark
- Subscribe
- Mute
- Subscribe to RSS Feed
- Permalink
- Report Inappropriate Content
Your set up looks the same as mine. The only other thing that I can think to check is I am using Direct Query. Are you using Direct Query or loading your data?
- Mark as New
- Bookmark
- Subscribe
- Mute
- Subscribe to RSS Feed
- Permalink
- Report Inappropriate Content
@Dave_Gugg I click Get Date->Excel, and load my data. Please check if loading data is successfuly. Jenerally, the operation will works fine if we load data successfully.
Best Regards,
Angelia

Helpful resources

FabCon Global Hackathon
Join the Fabric FabCon Global Hackathon—running virtually through Nov 3. Open to all skill levels. $10,000 in prizes!

Power BI Monthly Update - October 2025
Check out the October 2025 Power BI update to learn about new features.

FabCon Atlanta 2026
Join us at FabCon Atlanta, March 16-20, for the ultimate Fabric, Power BI, AI and SQL community-led event. Save $200 with code FABCOMM.


