Forum Discussion

ldmass's avatar
ldmass
Regular Visitor
3 years ago
Solved

Get last sequences for a value in date range

Hi Experts,
I'm having trouble solving an issue that seems simple but I can't find the solution. I have a table where I have the following columns:

SinisterSequenceDatePatientEpisodeType of Coverage
1000101-01-2022Juan12
1000205-01-2022Juan24
1000302-02-2022Juan31
1000415-02-2022Juan44
1001102-02-2022Pedro14
1001215-01-2022Pedro42
1001302-02-2022Pedro54
1000501-03-2022Juan48

I need for a range of dates to show the last Sequence (Column B) for the same Sinister (Column A), and then filter by Type of Coverage (Column F). For example:
Example 1:
If in the date slicer I select 01-01-2022 to 01-31-2022, only row 4 should be displayed in the matrix/table. Why?
- For Sinister 1000, the last sequence is 2 and type of coverage is 4
- For Sinister 1001, the last sequence is 2 but the Type of Coverage is 2.


Example 2:
If in the date slicer I select 01-01-2022 to 28-02-2022, only row 5 and 8 should be displayed in the matrix/table. Why?
- For Sinister 1000, the last sequence is 4 and type of coverage is 4.
- For Sinister 1001, the last sequence is 3 and type of coverage is 4.


Any help is welcome.


Greetings,

LM

  • HI  ldmass ,

    Adjust to the below:

    TEST = var maxdate=CALCULATE (
            MAX ( 'Table'[Date] ),
            FILTER (
                ALL ( 'Table' ),
                'Table'[Sinister] = MAX ( 'Table'[Sinister] )
                    && 'Table'[Date] >= CALCULATE ( MIN ( 'Date'[Date] ), ALLSELECTED ( 'Date' ) )
                    && 'Table'[Date] <= CALCULATE ( MAX ( 'Date'[Date] ), ALLSELECTED ( 'Date' ) )
            )
        )  var pd1= IF (
        CALCULATE (
            MAX ( 'Table'[Date] ),
            FILTER (
                ALL ( 'Table' ),
                'Table'[Sinister] = MAX ( 'Table'[Sinister] )
                    && 'Table'[Date] >= CALCULATE ( MIN ( 'Date'[Date] ), ALLSELECTED ( 'Date' ) )
                    && 'Table'[Date] <= CALCULATE ( MAX ( 'Date'[Date] ), ALLSELECTED ( 'Date' ) )
            )
        )
            = MAX ( 'Table'[Date] ),
        1,
        0
    ) var pd2=IF(MAX('Table'[Sequence])=
    CALCULATE (
            MAX ( 'Table'[Sequence]),
            FILTER (
                ALL ( 'Table' ),
                'Table'[Sinister] = MAX ( 'Table'[Sinister] )&&'Table'[Date]= maxdate)),1,0)  return  IF(PD1=1&&pd2=1,1,0)

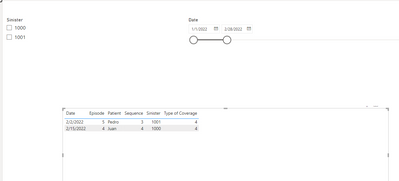
    Result:


    Best Regards

    Lucien

3 Replies

  • v-luwang-msft's avatar
    v-luwang-msft
    Icon for Community Support rankCommunity Support

    HI  ldmass ,

    Pls use the below measure ,then filter the measure:

    TEST = 
    IF (
        CALCULATE (
            MAX ( 'Table'[Date] ),
            FILTER (
                ALL ( 'Table' ),
                'Table'[Sinister] = MAX ( 'Table'[Sinister] )
                    && 'Table'[Date] >= CALCULATE ( MIN ( 'Date'[Date] ), ALLSELECTED ( 'Date' ) )
                    && 'Table'[Date] <= CALCULATE ( MAX ( 'Date'[Date] ), ALLSELECTED ( 'Date' ) )
            )
        )
            = MAX ( 'Table'[Date] ),
        1,
        0
    )
    

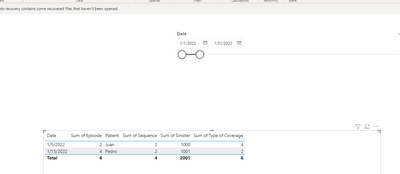
    Output result:(the second slicer ,with two same last date on 1001,so with the two result)


    Best Regards

    Lucien


    • ldmass's avatar
      ldmass
      Regular Visitor

      Hi Lucien,

      Thanks you for your answer. In the second image, only sequence 3 should be displayed, since it is the largest, regardless of the date. For the selected date range, only the largest sequence should be displayed

      • v-luwang-msft's avatar
        v-luwang-msft
        Icon for Community Support rankCommunity Support

        HI  ldmass ,

        Adjust to the below:

        TEST = var maxdate=CALCULATE (
                MAX ( 'Table'[Date] ),
                FILTER (
                    ALL ( 'Table' ),
                    'Table'[Sinister] = MAX ( 'Table'[Sinister] )
                        && 'Table'[Date] >= CALCULATE ( MIN ( 'Date'[Date] ), ALLSELECTED ( 'Date' ) )
                        && 'Table'[Date] <= CALCULATE ( MAX ( 'Date'[Date] ), ALLSELECTED ( 'Date' ) )
                )
            )  var pd1= IF (
            CALCULATE (
                MAX ( 'Table'[Date] ),
                FILTER (
                    ALL ( 'Table' ),
                    'Table'[Sinister] = MAX ( 'Table'[Sinister] )
                        && 'Table'[Date] >= CALCULATE ( MIN ( 'Date'[Date] ), ALLSELECTED ( 'Date' ) )
                        && 'Table'[Date] <= CALCULATE ( MAX ( 'Date'[Date] ), ALLSELECTED ( 'Date' ) )
                )
            )
                = MAX ( 'Table'[Date] ),
            1,
            0
        ) var pd2=IF(MAX('Table'[Sequence])=
        CALCULATE (
                MAX ( 'Table'[Sequence]),
                FILTER (
                    ALL ( 'Table' ),
                    'Table'[Sinister] = MAX ( 'Table'[Sinister] )&&'Table'[Date]= maxdate)),1,0)  return  IF(PD1=1&&pd2=1,1,0)

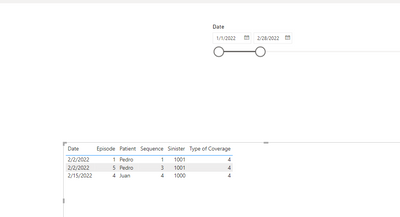
        Result:


        Best Regards

        Lucien