FabCon is coming to Atlanta
Join us at FabCon Atlanta from March 16 - 20, 2026, for the ultimate Fabric, Power BI, AI and SQL community-led event. Save $200 with code FABCOMM.
Register now!- Power BI forums
- Get Help with Power BI
- Desktop
- Service
- Report Server
- Power Query
- Mobile Apps
- Developer
- DAX Commands and Tips
- Custom Visuals Development Discussion
- Health and Life Sciences
- Power BI Spanish forums
- Translated Spanish Desktop
- Training and Consulting
- Instructor Led Training
- Dashboard in a Day for Women, by Women
- Galleries
- Data Stories Gallery
- Themes Gallery
- Contests Gallery
- QuickViz Gallery
- Quick Measures Gallery
- Visual Calculations Gallery
- Notebook Gallery
- Translytical Task Flow Gallery
- TMDL Gallery
- R Script Showcase
- Webinars and Video Gallery
- Ideas
- Custom Visuals Ideas (read-only)
- Issues
- Issues
- Events
- Upcoming Events
Vote for your favorite vizzies from the Power BI Dataviz World Championship submissions. Vote now!
- Power BI forums
- Forums
- Get Help with Power BI
- Desktop
- Final Calculated Column is displaying incorrect re...
- Subscribe to RSS Feed
- Mark Topic as New
- Mark Topic as Read
- Float this Topic for Current User
- Bookmark
- Subscribe
- Printer Friendly Page
- Mark as New
- Bookmark
- Subscribe
- Mute
- Subscribe to RSS Feed
- Permalink
- Report Inappropriate Content
Final Calculated Column is displaying incorrect results. (Example .pbix file included)
I have "Merged" various columns from 3 tables into a table called "Table: All Absence Details".
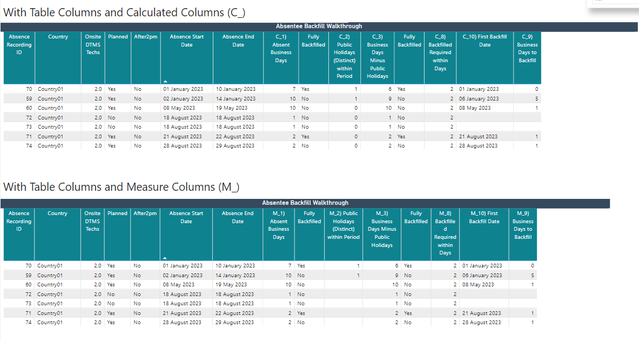
I then created a "Table Visual" using columns (including "Absence Start Date") from the table "Table: All Absence Details" and also created Some calculated columns in the same table. These columns are prefixed with "C_" and can be found in the "Table: All Absence Details" table container.
I then created a "Slicer" using the column "Absence Start Date (same as the slicer). This filtered the table visual as expected.
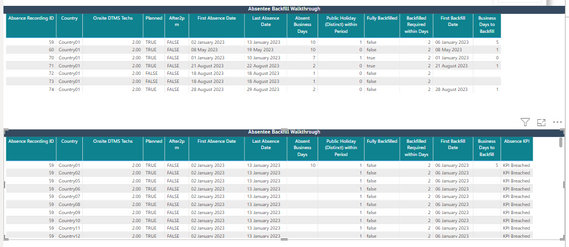
The problem is, when I add the final caculated column called "C_11) Absence KPI" that checks the values of the othger calculated columns and either displays "KPI Met" or KPI Breached", it gives incorrect results.
As an example, the below should be "KPI Met", but its not working.
I have tried using measures instead of Calculated columns and this then stops the table visual from filtering, so I am completely confused. You can also find measures with the prefix "M_" in the "Table: All Absence Details" table container.
As you can see both tables using Calculated Columns "C_" or Measures "M_" initially display ok, although the Caclculate Columns tables doesnt display the correct values for final Calculated Column called "C_11) Absence KPI" is add and the Measure table filters incorrectly when a date is selected from the slicer, but displays the correct results when "M_11) Absence KPI" is added.
Ultimately, I just want a table visual that displays the desired columns and filters.
Thanks in advance and sorry about the length of the post 🙄 but have tried to breakdown into easy chunks.
Solved! Go to Solution.
- Mark as New
- Bookmark
- Subscribe
- Mute
- Subscribe to RSS Feed
- Permalink
- Report Inappropriate Content
@StuartSmith , A calculated column can not use slicer values a measure can, you have to create a measure
Absence KPI = IF(SELECTEDVALUE('Table: All Absence Details'[Fully Backfilled]) = "Yes", "KPI Met", "KPI Breached")
In case you need a slicer on that, you need segmentation
very similar to this one
Customer Retention with Dynamic Segmentation, New/Lost/Retain Customer Count: https://youtu.be/EyL7KMw877Q
- Mark as New
- Bookmark
- Subscribe
- Mute
- Subscribe to RSS Feed
- Permalink
- Report Inappropriate Content
I feel I over complicated this question and made the post way too long (TLDR). I have reposted the question, but simplified it down to a couple of lines, instead of a novel. 😴
New question can be found here: Why does measure stop filtering and creates additional rows
- Mark as New
- Bookmark
- Subscribe
- Mute
- Subscribe to RSS Feed
- Permalink
- Report Inappropriate Content
I'm still trying to figure this out. I have the table visual with all the column displaying and filtering apart from the "Absence KPI" measure because as soon as I add that measure, the table visual rows increases and I dont understand why.
Can someone please take a look at the attached updated file and explain to me why it is doing this and how I can get around it.
Thanks in advance.
- Mark as New
- Bookmark
- Subscribe
- Mute
- Subscribe to RSS Feed
- Permalink
- Report Inappropriate Content
Can anyone please help with why the table visual stops filtering AND adds lots of rows once I add the "Absence KPI". I am total lost.
Thanks
- Mark as New
- Bookmark
- Subscribe
- Mute
- Subscribe to RSS Feed
- Permalink
- Report Inappropriate Content
@StuartSmith , A calculated column can not use slicer values a measure can, you have to create a measure
Absence KPI = IF(SELECTEDVALUE('Table: All Absence Details'[Fully Backfilled]) = "Yes", "KPI Met", "KPI Breached")
In case you need a slicer on that, you need segmentation
very similar to this one
Customer Retention with Dynamic Segmentation, New/Lost/Retain Customer Count: https://youtu.be/EyL7KMw877Q
- Mark as New
- Bookmark
- Subscribe
- Mute
- Subscribe to RSS Feed
- Permalink
- Report Inappropriate Content
Thanks Amit, I had already tried the measure approach you suggested, and that gives the desired results, but then the silcer filter doesn't filter the table visual. I will take a look at your link.
Helpful resources

Power BI Dataviz World Championships
Vote for your favorite vizzies from the Power BI World Championship submissions!

Join our Community Sticker Challenge 2026
If you love stickers, then you will definitely want to check out our Community Sticker Challenge!

Power BI Monthly Update - January 2026
Check out the January 2026 Power BI update to learn about new features.

| User | Count |
|---|---|
| 57 | |
| 54 | |
| 42 | |
| 16 | |
| 16 |
| User | Count |
|---|---|
| 113 | |
| 105 | |
| 39 | |
| 35 | |
| 26 |


