FabCon is coming to Atlanta
Join us at FabCon Atlanta from March 16 - 20, 2026, for the ultimate Fabric, Power BI, AI and SQL community-led event. Save $200 with code FABCOMM.
Register now!- Power BI forums
- Get Help with Power BI
- Desktop
- Service
- Report Server
- Power Query
- Mobile Apps
- Developer
- DAX Commands and Tips
- Custom Visuals Development Discussion
- Health and Life Sciences
- Power BI Spanish forums
- Translated Spanish Desktop
- Training and Consulting
- Instructor Led Training
- Dashboard in a Day for Women, by Women
- Galleries
- Data Stories Gallery
- Themes Gallery
- Contests Gallery
- QuickViz Gallery
- Quick Measures Gallery
- Visual Calculations Gallery
- Notebook Gallery
- Translytical Task Flow Gallery
- TMDL Gallery
- R Script Showcase
- Webinars and Video Gallery
- Ideas
- Custom Visuals Ideas (read-only)
- Issues
- Issues
- Events
- Upcoming Events
Get Fabric Certified for FREE during Fabric Data Days. Don't miss your chance! Request now
- Power BI forums
- Forums
- Get Help with Power BI
- Desktop
- Re: Filter not working as expected
- Subscribe to RSS Feed
- Mark Topic as New
- Mark Topic as Read
- Float this Topic for Current User
- Bookmark
- Subscribe
- Printer Friendly Page

- Mark as New
- Bookmark
- Subscribe
- Mute
- Subscribe to RSS Feed
- Permalink
- Report Inappropriate Content
Filter not working as expected
Hi,
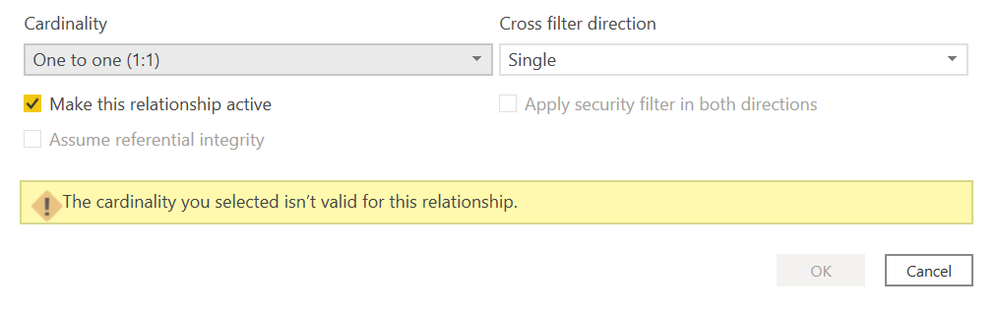
I created a new table using summarizecolumns() and both the new table and source table have a column "Type". I have a dropdown filter for Type on the page which is not impacting the values of the new table. I tried creating a relationship but it said error due to circular dependency. I want to be able to filter out values based on "Type".
Any help would be appreciated.


- Mark as New
- Bookmark
- Subscribe
- Mute
- Subscribe to RSS Feed
- Permalink
- Report Inappropriate Content
@Anonymous , First of all, slicer values are not taken by new table.
Share the table script to check. Try to use summarize in place summarizecolumns and check if join works
- Mark as New
- Bookmark
- Subscribe
- Mute
- Subscribe to RSS Feed
- Permalink
- Report Inappropriate Content
Hi, thanks for your response. Can you please elaborate on why slicer values don't affect the new table? Also the DAX Query for creating the new table is:
Table2 = SUMMARIZECOLUMNS(Table1[Type],Table1[Date].[Year],Table1[Date].[MonthNo],"Number of rows", COUNT(Table1[ID]))


- Mark as New
- Bookmark
- Subscribe
- Mute
- Subscribe to RSS Feed
- Permalink
- Report Inappropriate Content
Hi @Anonymous ,
As tested here,it works fine,no error returns.
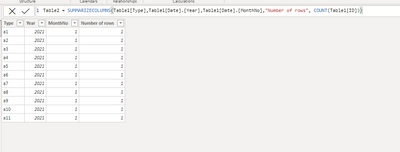
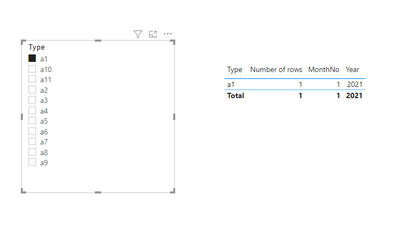
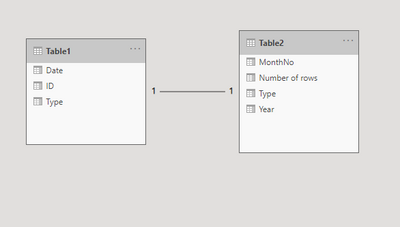
Could you pls share your .pbix file for test?Remember to remove the confidential information.
For my .pbix file,pls see attached.
Best Regards,
Kelly
Did I answer your question? Mark my post as a solution!
- Mark as New
- Bookmark
- Subscribe
- Mute
- Subscribe to RSS Feed
- Permalink
- Report Inappropriate Content
Thanks for your response, but I can't share my PBIX file. But the issue is that in my file a one to one relationship between "Type" is not being accepted as a valid one and others have a circular dependency issue. And I have a date and type filter (from table 1) on the page which aren't working if they're not having an active relationship between the types or dates.
- Mark as New
- Bookmark
- Subscribe
- Mute
- Subscribe to RSS Feed
- Permalink
- Report Inappropriate Content
Hi @Anonymous ,
Could you pls show some sample data with expected output?
Best Regards,
Kelly
Did I answer your question? Mark my post as a solution!
- Mark as New
- Bookmark
- Subscribe
- Mute
- Subscribe to RSS Feed
- Permalink
- Report Inappropriate Content
Hi @v-kelly-msft,
I can only attach the screenshots since I don't have an attach file option available. The slicers for type and date are from original table and the graph needs to be filtered by both the slicers which is not happening. The only relationship allowed between "Type" of the tables is many to many and then the graph does not get filtered by the date slicer. I tried creating columns in both the tables to have matchable dates - monthly 1st date in original date and a combinevalue column in summarized table and then create a relationship which is not accepted.
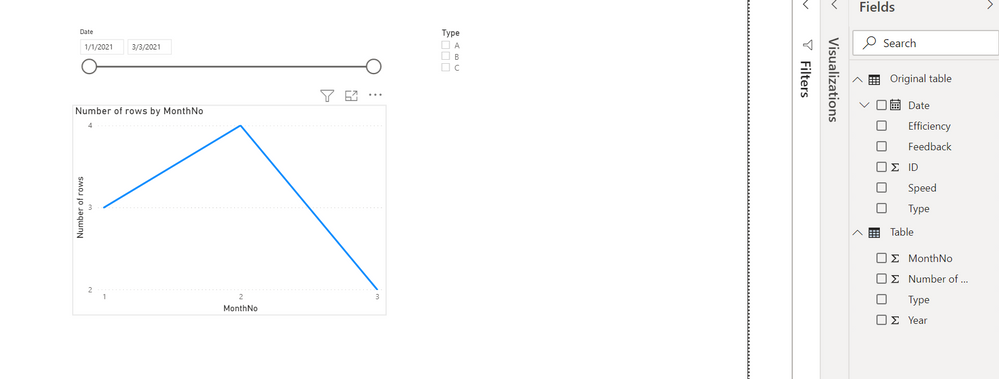

- Mark as New
- Bookmark
- Subscribe
- Mute
- Subscribe to RSS Feed
- Permalink
- Report Inappropriate Content
Hi @Anonymous ,
Is your issue solved?Does my suggestion work ?
Best Regards,
Kelly
Did I answer your question? Mark my post as a solution!
- Mark as New
- Bookmark
- Subscribe
- Mute
- Subscribe to RSS Feed
- Permalink
- Report Inappropriate Content
Apologies for the delay in response, but a one to one relationship is not being allowed between "Type" and thus am not able to resolve it using this, thanks for your response.
- Mark as New
- Bookmark
- Subscribe
- Mute
- Subscribe to RSS Feed
- Permalink
- Report Inappropriate Content
Hi @Anonymous ,
No,what I mean is to create a dimensional table between the 2 tables then create a one to one relationship as my sample show it.
Best Regards,
Kelly
Did I answer your question? Mark my post as a solution!
- Mark as New
- Bookmark
- Subscribe
- Mute
- Subscribe to RSS Feed
- Permalink
- Report Inappropriate Content
Hi @v-kelly-msft,
As I mentioned before, a one to one relationship is not being allowed between the "Type" dimension table and the other Table1 and Table2.
- Mark as New
- Bookmark
- Subscribe
- Mute
- Subscribe to RSS Feed
- Permalink
- Report Inappropriate Content
Hi @Anonymous ,
Relationship is not the key factor,could you pls provide some sample data with expected output for test?
Best Regards,
Kelly
Did I answer your question? Mark my post as a solution!
- Mark as New
- Bookmark
- Subscribe
- Mute
- Subscribe to RSS Feed
- Permalink
- Report Inappropriate Content
Hi @v-kelly-msft,
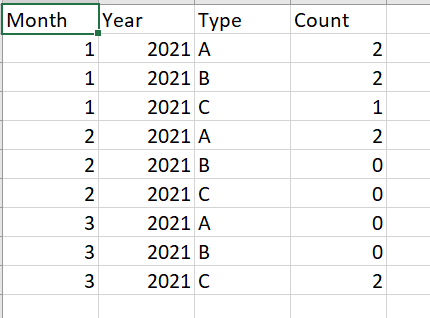
What essentially happens is this:
There is a table "A" which consists of id, type, date, a few questions.
Another table "S" consists of id, type, date (month and year format) with the number of types per month.
I need to plot a graph for number of A per month and S per month.
But A doesn't directly have number of rows per month, for which I use SUMMARIZECOLUMNS to achieve the same (say R).
The page has filters from A (type and date) which need to be able to filter out the graph consisting S and R.
A isn't filtering out R itself even with a many to many relationship between types.
Attaching screenshots for A and R.

- Mark as New
- Bookmark
- Subscribe
- Mute
- Subscribe to RSS Feed
- Permalink
- Report Inappropriate Content
Hi @Anonymous ,
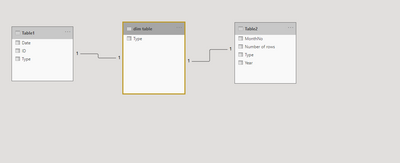
If so,create a dimensional table for "Type":
dim table = VALUES('Original table'[Type])Then create relationships as below among the three tables:
Best Regards,
Kelly
Did I answer your question? Mark my post as a solution!
Helpful resources

Power BI Monthly Update - November 2025
Check out the November 2025 Power BI update to learn about new features.

Fabric Data Days
Advance your Data & AI career with 50 days of live learning, contests, hands-on challenges, study groups & certifications and more!

FabCon Atlanta 2026
Join us at FabCon Atlanta, March 16-20, for the ultimate Fabric, Power BI, AI and SQL community-led event. Save $200 with code FABCOMM.


