New Offer! Become a Certified Fabric Data Engineer
Check your eligibility for this 50% exam voucher offer and join us for free live learning sessions to get prepared for Exam DP-700.
Get Started- Power BI forums
- Get Help with Power BI
- Desktop
- Service
- Report Server
- Power Query
- Mobile Apps
- Developer
- DAX Commands and Tips
- Custom Visuals Development Discussion
- Health and Life Sciences
- Power BI Spanish forums
- Translated Spanish Desktop
- Training and Consulting
- Instructor Led Training
- Dashboard in a Day for Women, by Women
- Galleries
- Community Connections & How-To Videos
- COVID-19 Data Stories Gallery
- Themes Gallery
- Data Stories Gallery
- R Script Showcase
- Webinars and Video Gallery
- Quick Measures Gallery
- 2021 MSBizAppsSummit Gallery
- 2020 MSBizAppsSummit Gallery
- 2019 MSBizAppsSummit Gallery
- Events
- Ideas
- Custom Visuals Ideas
- Issues
- Issues
- Events
- Upcoming Events
Don't miss out! 2025 Microsoft Fabric Community Conference, March 31 - April 2, Las Vegas, Nevada. Use code MSCUST for a $150 discount. Prices go up February 11th. Register now.
- Power BI forums
- Forums
- Get Help with Power BI
- Desktop
- Filter Matrix Entries by Sub Total of Measure
- Subscribe to RSS Feed
- Mark Topic as New
- Mark Topic as Read
- Float this Topic for Current User
- Bookmark
- Subscribe
- Printer Friendly Page
- Mark as New
- Bookmark
- Subscribe
- Mute
- Subscribe to RSS Feed
- Permalink
- Report Inappropriate Content
Filter Matrix Entries by Sub Total of Measure
Hi Everyone,
currently i am struggling with a filter Option in my Report.
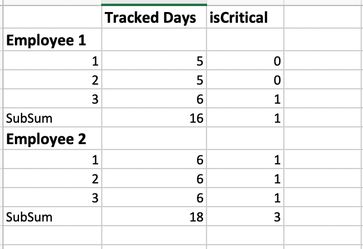
I have following Matrix:
I try to visualize the Ammount of Days, where an employye tracked time, grouped by the last three weeks. If an employee tracked more than five days, there Measure "isCritical" switches to 1. My Goal is, to show only those employees, who have three critical weeks in line (in other words: where the sum of isCritical = 3).
In this example, only employee 2 should be visible. I tried to work with COUNTROWS, but i don't get the expected Result. In my thougts, i need something like a filter option on the level of every subTotal.
Does someone has a proposal to solve the problem? Thanks for your help!
Solved! Go to Solution.
- Mark as New
- Bookmark
- Subscribe
- Mute
- Subscribe to RSS Feed
- Permalink
- Report Inappropriate Content
For now i found following work around solution:
I just store the total subSum in every row with following DAX:
sumIsCritical = CALCULATE([isCritical],ALL(DimDate[WeekOfYear]))
This allows me to filter all rows, where the value is 3 👍
- Mark as New
- Bookmark
- Subscribe
- Mute
- Subscribe to RSS Feed
- Permalink
- Report Inappropriate Content
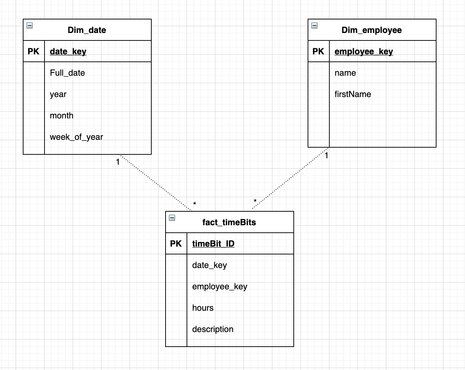
What does the underlying data look like?
- Mark as New
- Bookmark
- Subscribe
- Mute
- Subscribe to RSS Feed
- Permalink
- Report Inappropriate Content
The whole data Model is much more complicated, but this should visualize the required tables in an abstract way. In Power BI I have an calculated column, which filter the last three weeks. TrackedDays is calculated by a distinct rowCount on daily Base where trackedTimes != 0.
Helpful resources

Join us at the Microsoft Fabric Community Conference
March 31 - April 2, 2025, in Las Vegas, Nevada. Use code MSCUST for a $150 discount!

Power BI Monthly Update - January 2025
Check out the January 2025 Power BI update to learn about new features in Reporting, Modeling, and Data Connectivity.

| User | Count |
|---|---|
| 116 | |
| 82 | |
| 45 | |
| 42 | |
| 28 |
| User | Count |
|---|---|
| 182 | |
| 82 | |
| 71 | |
| 48 | |
| 45 |


