Forum Discussion

Dynamic visual legend
Hello
Is their a way to do a lengend with a values that come from a slicer. ?
I used a SELECTEDVALUE on a calculated column but it is not refreshed :/
5 Replies
- amitchandakSuper User
The information you have provided is not making the problem clear to me. Can you please explain with an example. If possible please share a sample pbix file after removing sensitive information.
Thanks  v-frfei-msftCommunity Support
Hi Anonymous ,
One sample for your reference, please check the following steps as below.
1. dupilicate the fact table, then tranpose and unpivot the table as below. M code for your reference.
let
    Source = Table.FromRows(Json.Document(Binary.Decompress(Binary.FromText("HcipFQAgDETBXlZjAqGavAiO/muAHzNiIrTUtOxzwJQttLnOwag73ODA6y7nHExlPg==", BinaryEncoding.Base64), Compression.Deflate)), let _t = ((type text) meta [Serialized.Text = true]) in type table [category = _t, category.1 = _t, category.2 = _t, value = _t]),
    #"Changed Type" = Table.TransformColumnTypes(Source,{{"category", type text}, {"category.1", type text}, {"category.2", type text}, {"value", Int64.Type}}),
    #"Demoted Headers" = Table.DemoteHeaders(#"Changed Type"),
    #"Changed Type1" = Table.TransformColumnTypes(#"Demoted Headers",{{"Column1", type text}, {"Column2", type text}, {"Column3", type text}, {"Column4", type any}}),
    #"Transposed Table" = Table.Transpose(#"Changed Type1"),
    #"Filtered Rows" = Table.SelectRows(#"Transposed Table", each ([Column1] <> "value")),
    #"Unpivoted Other Columns" = Table.UnpivotOtherColumns(#"Filtered Rows", {"Column1"}, "Attribute", "Value"),
    #"Removed Columns" = Table.RemoveColumns(#"Unpivoted Other Columns",{"Attribute"}),
    #"Renamed Columns" = Table.RenameColumns(#"Removed Columns",{{"Column1", "category type"}, {"Value", "category"}})
in
    #"Renamed Columns"
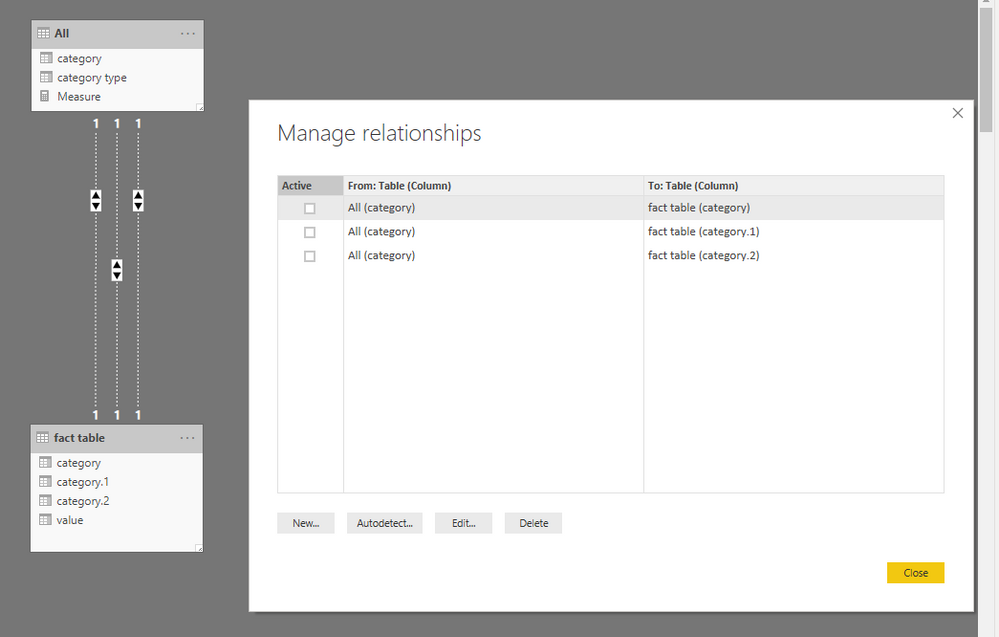
2. Create relationship between tables as below.
3. To create a measure as below to make the goal achieved.
Measure = VAR c = CALCULATE ( SUM ( 'fact table'[value] ), USERELATIONSHIP ( 'fact table'[category], 'All'[category] ) ) VAR c1 = CALCULATE ( SUM ( 'fact table'[value] ), USERELATIONSHIP ( 'fact table'[category.1], 'All'[category] ) ) VAR c2 = CALCULATE ( SUM ( 'fact table'[value] ), USERELATIONSHIP ( 'fact table'[category.2], 'All'[category] ) ) VAR sele = SELECTEDVALUE ( 'All'[category type] ) RETURN IF ( ISBLANK ( sele ), BLANK (), SWITCH ( sele, "category", c, "category.1", c1, "category.2", c2 ) )- AnonymousNot applicable
Hello v-frfei-msft
Thank you for your response, can you send a pbix example.?
I didn't understand the first step, My fact table is huge. Could this work without afecting the performance ?- v-frfei-msftCommunity Support