Forum Discussion

Dynamic KPI
HI All,
I am using a KPI to color green, red, orange from two fields which use dynamically changing data ie. the value changes. But when the value change the KPI displays the wrong color.
Desired Logic;
IF (B-A)>0, THEN [Green]
IF(B-A) <0, THEN [Red]
IF(B-A)=0, THEN [Orange]
You can see in screen shot that B is larger than A but it is red.
Second screen shot shows the fields used for A.
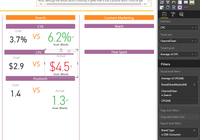
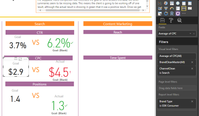
These columns are in different data sets. So we are unable to do a merge join or condiitonal formatting on the data, so I need a custom DAX for this?
Thanks for any assistance.
2 Replies
 MalSResolver III
This might be a silly question, but did you check the formatting of the KPI?
In the Color Coding section you can set the Direction - either 'low is good' or 'high is good'. Maybe you just have that around the wrong way?
- MalSResolver III
Nevermind - I see that the goal value is blank on the KPI, so ignore my last post.
The KPI is using the most recent (based on the trend axis) value for the Indicator and the Target Goal. If you do a simple table with your Trend Axis field (ChannelClean), your Indicator field (CPC) and Target Goal field (Average of CPC) included, then scroll to the very bottom - what do you see? Is the Average of CPC value blank? If so, that is going to cause problems.
Normally the Trend Axis is a list of dates from a calendar table. What is the ChannelClean field that you are using for the Trend Axis? Is it a list of dates, or something else?
Regards,
Mal