- Subscribe to RSS Feed
- Mark Topic as New
- Mark Topic as Read
- Float this Topic for Current User
- Bookmark
- Subscribe
- Printer Friendly Page
- Mark as New
- Bookmark
- Subscribe
- Mute
- Subscribe to RSS Feed
- Permalink
- Report Inappropriate Content

Drill through chart
Hello All,
Could you explain to me what am I doing wrong ?
I want to drill through some result from column chart to get deatiled result in another page.
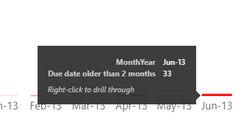
When I use drill through in column chart where I also have month and year everything works perfectly - screen below
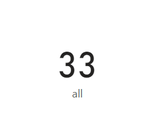
In June 2013 I have 33 records and this is what drill through page shows
Chart
Drill through page result :
But, when I use the same 3 measures (Over 60 days, Due date earlier than 60 days, Due date within 2 months) without month and year, just the totals and I want to get deatils about only one measure (in this example is a due date within 2 months) in drill through page I receive deatails for all of 3 measures, not only for the one which I picked.
Chart (4491) :
Drill through page (over 62k) :
Is there a chance to get it done right ?
- Mark as New
- Bookmark
- Subscribe
- Mute
- Subscribe to RSS Feed
- Permalink
- Report Inappropriate Content

Hi @Niunias ,
I am temporarily unable to do further testing. Can you provide more information, such as test data (delete sensitive information), etc. I will answer you as soon as possible.
How to Get Your Question Answered Quickly - Microsoft Power BI Community
Looking forward to your reply.
Best Regards,
Henry
Helpful resources
| Subject | Author | Posted | |
|---|---|---|---|
| 08-12-2024 01:19 AM | |||
| 03-07-2025 07:58 AM | |||
| 02-12-2025 08:56 PM | |||
| 02-13-2025 02:00 PM | |||
| 02-25-2025 01:50 PM |
| User | Count |
|---|---|
| 100 | |
| 68 | |
| 59 | |
| 47 | |
| 46 |


