FabCon is coming to Atlanta
Join us at FabCon Atlanta from March 16 - 20, 2026, for the ultimate Fabric, Power BI, AI and SQL community-led event. Save $200 with code FABCOMM.
Register now!- Power BI forums
- Get Help with Power BI
- Desktop
- Service
- Report Server
- Power Query
- Mobile Apps
- Developer
- DAX Commands and Tips
- Custom Visuals Development Discussion
- Health and Life Sciences
- Power BI Spanish forums
- Translated Spanish Desktop
- Training and Consulting
- Instructor Led Training
- Dashboard in a Day for Women, by Women
- Galleries
- Data Stories Gallery
- Themes Gallery
- Contests Gallery
- QuickViz Gallery
- Quick Measures Gallery
- Visual Calculations Gallery
- Notebook Gallery
- Translytical Task Flow Gallery
- TMDL Gallery
- R Script Showcase
- Webinars and Video Gallery
- Ideas
- Custom Visuals Ideas (read-only)
- Issues
- Issues
- Events
- Upcoming Events
The Power BI Data Visualization World Championships is back! Get ahead of the game and start preparing now! Learn more
- Power BI forums
- Forums
- Get Help with Power BI
- Desktop
- DistinctCount with filters
- Subscribe to RSS Feed
- Mark Topic as New
- Mark Topic as Read
- Float this Topic for Current User
- Bookmark
- Subscribe
- Printer Friendly Page
- Mark as New
- Bookmark
- Subscribe
- Mute
- Subscribe to RSS Feed
- Permalink
- Report Inappropriate Content
DistinctCount with filters
Hi,
I'm trying to create a measure using distinctcount to calcualate the number of visits made by each user in each month.
Here's what my table looks like:
Table1
| VisitID | UserID | VisitDate |
| 1 | A | 1/1/2020 |
| 2 | A | 1/1/2020 |
| 3 | B | 3/1/2020 |
| 4 | A | 1/2/2020 |
| 5 | B | 1/2/2020 |
| 6 | B | 3/2/2020 |
| 7 | A | 1/3/2020 |
| 8 | C | 1/3/2020 |
The output should look like
| UserID | Month | Visits |
| A | January 2020 | 2 |
| B | January 2020 | 1 |
| A | February 2020 | 1 |
| B | February 2020 | 2 |
| A | March 2020 | 1 |
| C | March 2020 | 1 |
Thanks in advance!
Solved! Go to Solution.
- Mark as New
- Bookmark
- Subscribe
- Mute
- Subscribe to RSS Feed
- Permalink
- Report Inappropriate Content
@djaaiin93 I am sharing the PBIX file for your reference.
Did I answer your question? Mark my post as a solution!
Appreciate your Kudos
Proud to be a Super User!
Follow me on linkedin
- Mark as New
- Bookmark
- Subscribe
- Mute
- Subscribe to RSS Feed
- Permalink
- Report Inappropriate Content
The above pbix has a simple measure and it works fine!
It was an issue with my relationships which I was able to resolve.
for anyone who's new to powerBI and faces this issue, remember that your active relationships work as filters for your data. Having a well modeled data model saves you a world of pain.
thanks again negi007 !
- Mark as New
- Bookmark
- Subscribe
- Mute
- Subscribe to RSS Feed
- Permalink
- Report Inappropriate Content
@djaaiin93 I am sharing the PBIX file for your reference.
Did I answer your question? Mark my post as a solution!
Appreciate your Kudos
Proud to be a Super User!
Follow me on linkedin
- Mark as New
- Bookmark
- Subscribe
- Mute
- Subscribe to RSS Feed
- Permalink
- Report Inappropriate Content
Hi,
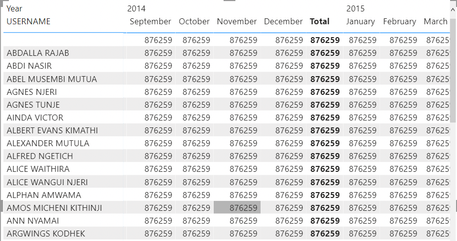
Thanks for your reply. It's crazy because I've been racking my head trying something overly complicated. I tried using the count, countrows, distinctcount functions but I keep seeing the same value (total number of rows in the table) being repeated for each user and each month-year. I only have data starting from Nov 2020 but this function shows values from 2014 to 2099 (Entire date range of my date table). It seems like the relationships I have is where the issue is.
Helpful resources

Power BI Monthly Update - November 2025
Check out the November 2025 Power BI update to learn about new features.

Fabric Data Days
Advance your Data & AI career with 50 days of live learning, contests, hands-on challenges, study groups & certifications and more!


