Fabric Data Days starts November 4th!
Advance your Data & AI career with 50 days of live learning, dataviz contests, hands-on challenges, study groups & certifications and more!
Get registered- Power BI forums
- Get Help with Power BI
- Desktop
- Service
- Report Server
- Power Query
- Mobile Apps
- Developer
- DAX Commands and Tips
- Custom Visuals Development Discussion
- Health and Life Sciences
- Power BI Spanish forums
- Translated Spanish Desktop
- Training and Consulting
- Instructor Led Training
- Dashboard in a Day for Women, by Women
- Galleries
- Data Stories Gallery
- Themes Gallery
- Contests Gallery
- QuickViz Gallery
- Quick Measures Gallery
- Visual Calculations Gallery
- Notebook Gallery
- Translytical Task Flow Gallery
- TMDL Gallery
- R Script Showcase
- Webinars and Video Gallery
- Ideas
- Custom Visuals Ideas (read-only)
- Issues
- Issues
- Events
- Upcoming Events
Get Fabric Certified for FREE during Fabric Data Days. Don't miss your chance! Request now
- Power BI forums
- Forums
- Get Help with Power BI
- Desktop
- Re: Display two values for each date on stacked co...
- Subscribe to RSS Feed
- Mark Topic as New
- Mark Topic as Read
- Float this Topic for Current User
- Bookmark
- Subscribe
- Printer Friendly Page


- Mark as New
- Bookmark
- Subscribe
- Mute
- Subscribe to RSS Feed
- Permalink
- Report Inappropriate Content
Display two values for each date on stacked column chart
Hi all,
I need to dispaly two values for each date on stacked column chart, somthing like this:
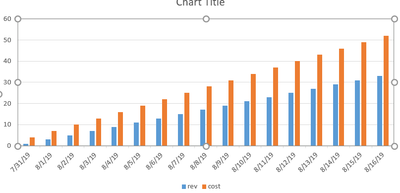
Solved! Go to Solution.


- Mark as New
- Bookmark
- Subscribe
- Mute
- Subscribe to RSS Feed
- Permalink
- Report Inappropriate Content
If your table looks like this

I don't know why it didn't work on your side
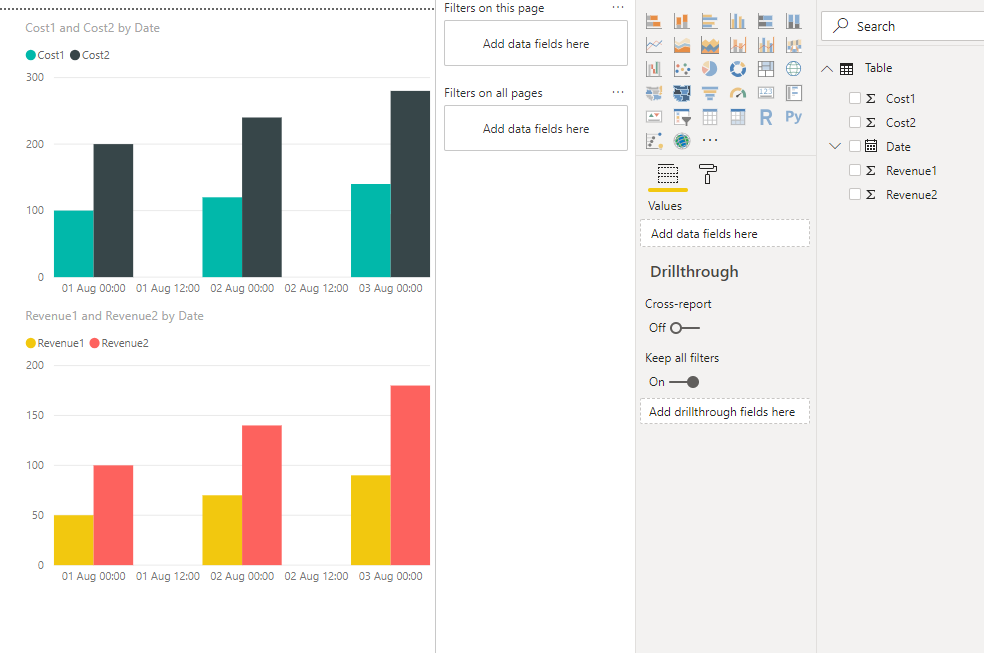
Since I cannot reporduce your issue, I hope someone can help you.
Have a nice day!


- Mark as New
- Bookmark
- Subscribe
- Mute
- Subscribe to RSS Feed
- Permalink
- Report Inappropriate Content
U need to create 2 measures using this colums and use it in visual.
In your case it will be
Measure 1 = SUM(Column 1)
Measure 2 = SUM(Column 2)
And U need to use "clustered column chart" not stacked. 😉


- Mark as New
- Bookmark
- Subscribe
- Mute
- Subscribe to RSS Feed
- Permalink
- Report Inappropriate Content
Hi @giorgi_lommidd ,
Have you solved your problem?
If you have solved, please always accept the replies making sense as solution to your question so that people who may have the same question can get the solution directly.
If you still need help, please share your data sample which could reproduce the scenario and your desired output so that we could help further on it.
Best Regards,
Cherry
If this post helps, then please consider Accept it as the solution to help the other members find it more quickly.
- Mark as New
- Bookmark
- Subscribe
- Mute
- Subscribe to RSS Feed
- Permalink
- Report Inappropriate Content
U need to create 2 measures using this colums and use it in visual.
In your case it will be
Measure 1 = SUM(Column 1)
Measure 2 = SUM(Column 2)
And U need to use "clustered column chart" not stacked. 😉
- Mark as New
- Bookmark
- Subscribe
- Mute
- Subscribe to RSS Feed
- Permalink
- Report Inappropriate Content
This might be possible if you will elaborate what you really need
- Mark as New
- Bookmark
- Subscribe
- Mute
- Subscribe to RSS Feed
- Permalink
- Report Inappropriate Content
I have table with 5 olumn : date, cost1, cost2, revenue1 and revenue 2 need to dispalay costs (cost1 and cost2) in one stacked column and revenues (revenue1 and revenue2) in another stacked column for same date
- Mark as New
- Bookmark
- Subscribe
- Mute
- Subscribe to RSS Feed
- Permalink
- Report Inappropriate Content
You can drag your date to axis, drag revenues to values since your revenue 1 and 2 are in different columns. Same with your costs
- Mark as New
- Bookmark
- Subscribe
- Mute
- Subscribe to RSS Feed
- Permalink
- Report Inappropriate Content
Sorry, but your suggestion did not work. Thanks fro response !
- Mark as New
- Bookmark
- Subscribe
- Mute
- Subscribe to RSS Feed
- Permalink
- Report Inappropriate Content
If your table looks like this
I don't know why it didn't work on your side
Since I cannot reporduce your issue, I hope someone can help you.
Have a nice day!

Helpful resources

Power BI Monthly Update - November 2025
Check out the November 2025 Power BI update to learn about new features.

Fabric Data Days
Advance your Data & AI career with 50 days of live learning, contests, hands-on challenges, study groups & certifications and more!

FabCon Atlanta 2026
Join us at FabCon Atlanta, March 16-20, for the ultimate Fabric, Power BI, AI and SQL community-led event. Save $200 with code FABCOMM.


| User | Count |
|---|---|
| 97 | |
| 73 | |
| 50 | |
| 46 | |
| 44 |


