- Power BI forums
- Updates
- News & Announcements
- Get Help with Power BI
- Desktop
- Service
- Report Server
- Power Query
- Mobile Apps
- Developer
- DAX Commands and Tips
- Custom Visuals Development Discussion
- Health and Life Sciences
- Power BI Spanish forums
- Translated Spanish Desktop
- Power Platform Integration - Better Together!
- Power Platform Integrations (Read-only)
- Power Platform and Dynamics 365 Integrations (Read-only)
- Training and Consulting
- Instructor Led Training
- Dashboard in a Day for Women, by Women
- Galleries
- Community Connections & How-To Videos
- COVID-19 Data Stories Gallery
- Themes Gallery
- Data Stories Gallery
- R Script Showcase
- Webinars and Video Gallery
- Quick Measures Gallery
- 2021 MSBizAppsSummit Gallery
- 2020 MSBizAppsSummit Gallery
- 2019 MSBizAppsSummit Gallery
- Events
- Ideas
- Custom Visuals Ideas
- Issues
- Issues
- Events
- Upcoming Events
- Community Blog
- Power BI Community Blog
- Custom Visuals Community Blog
- Community Support
- Community Accounts & Registration
- Using the Community
- Community Feedback
Earn a 50% discount on the DP-600 certification exam by completing the Fabric 30 Days to Learn It challenge.
- Power BI forums
- Forums
- Get Help with Power BI
- Desktop
- Difference in total vs raw data
- Subscribe to RSS Feed
- Mark Topic as New
- Mark Topic as Read
- Float this Topic for Current User
- Bookmark
- Subscribe
- Printer Friendly Page
- Mark as New
- Bookmark
- Subscribe
- Mute
- Subscribe to RSS Feed
- Permalink
- Report Inappropriate Content
Difference in total vs raw data
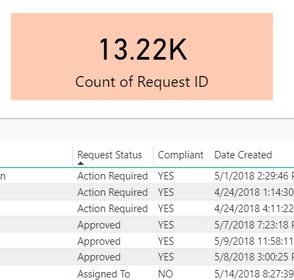
I made a report that shows a total of 13.22K records but when I add a table with all the rows, and I export it I see only 12K records. I have NO filters on the table or the tile showing totals. (image 1)
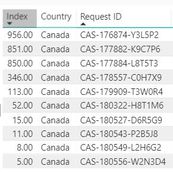
More...if I click on a filter that is supposed to show 10 records, the raw data displays 6 (image 2)
Any clue? Thanks

- Mark as New
- Bookmark
- Subscribe
- Mute
- Subscribe to RSS Feed
- Permalink
- Report Inappropriate Content
Added to Felipe point of addition of new index column, in advanced editor make sure to click on remove duplicate rows on that particular table.
You can also verify
13.22k is showing count of request id
change to count(distinct) of request id and see if you are getting Canada 10 by adding all the columns from table in to table visual than only 6 rows.
- Mark as New
- Bookmark
- Subscribe
- Mute
- Subscribe to RSS Feed
- Permalink
- Report Inappropriate Content
Hi @ezequiel,
If you have duplicate rows in your Table visual, it shows only 1.
Try adding an index column to your table and display it in the visual to confirm, but this is probably what happens.
And the solution is actually that, add an index column in the Table visual (you can change the size of the column to hide it).
Regards.
- Mark as New
- Bookmark
- Subscribe
- Mute
- Subscribe to RSS Feed
- Permalink
- Report Inappropriate Content
Thanks Felipe....I added the index and I see now the 10 rows which is good, but I don't understand how this can be considered as duplicated with all the Request IDs are different. Do you know why? Thanks!
Helpful resources
| User | Count |
|---|---|
| 94 | |
| 83 | |
| 78 | |
| 75 | |
| 66 |
| User | Count |
|---|---|
| 115 | |
| 105 | |
| 93 | |
| 65 | |
| 62 |


