FabCon is coming to Atlanta
Join us at FabCon Atlanta from March 16 - 20, 2026, for the ultimate Fabric, Power BI, AI and SQL community-led event. Save $200 with code FABCOMM.
Register now!- Power BI forums
- Get Help with Power BI
- Desktop
- Service
- Report Server
- Power Query
- Mobile Apps
- Developer
- DAX Commands and Tips
- Custom Visuals Development Discussion
- Health and Life Sciences
- Power BI Spanish forums
- Translated Spanish Desktop
- Training and Consulting
- Instructor Led Training
- Dashboard in a Day for Women, by Women
- Galleries
- Data Stories Gallery
- Themes Gallery
- Contests Gallery
- QuickViz Gallery
- Quick Measures Gallery
- Visual Calculations Gallery
- Notebook Gallery
- Translytical Task Flow Gallery
- TMDL Gallery
- R Script Showcase
- Webinars and Video Gallery
- Ideas
- Custom Visuals Ideas (read-only)
- Issues
- Issues
- Events
- Upcoming Events
The Power BI Data Visualization World Championships is back! Get ahead of the game and start preparing now! Learn more
- Power BI forums
- Forums
- Get Help with Power BI
- Desktop
- Dax to create a summary card based on rows distinc...
- Subscribe to RSS Feed
- Mark Topic as New
- Mark Topic as Read
- Float this Topic for Current User
- Bookmark
- Subscribe
- Printer Friendly Page
- Mark as New
- Bookmark
- Subscribe
- Mute
- Subscribe to RSS Feed
- Permalink
- Report Inappropriate Content
Dax to create a summary card based on rows distinct row count selected to a table
Dax to create a summary card based on rows distinct row count selected to a table
I need two Dax measures to:
1. Create a summary card "Total codes used by firm for all clients" to be the distinct count of column "Codes used by firm"
2. Create a summary card "Total number of codes used by all firms" to be the distinct count of column "potential codes that can be billed"
Rules:
The requirement is that the columns in table are distinct count of taskcodes used.
The table "report ProducerConsumerTaskCodes" is a subset of "report ConsumerTaskCodes".
Card "Total codes used by firm for all clients" is from table "report ProducerConsumerTaskCodes"
Card "Total number of codes used by all firms" is from table "report ConsumerTaskCodes".
Card "Total codes used by firm for all clients" is not expected to be equal to the sum of rows in "codes used by firm" because only unique codes aggregated.
Also,
Card "Total number of codes used by all firms" is not expected to be equal to the sum of rows in "Codes used by firm" because only unique codes are aggregated.
Note: One of the conditions for clients to be included in the table is that Total confidence score for the client must be greater than 50. See visual filter. This condition is expected to also apply to the summary card measure.
PBIX:
Solved! Go to Solution.
- Mark as New
- Bookmark
- Subscribe
- Mute
- Subscribe to RSS Feed
- Permalink
- Report Inappropriate Content
@v-xiaotang v-xiaotang
Unfortunately, the the issue could not be reproduced with the datset sampple. I have a new updated PBIX and screenshot here ....
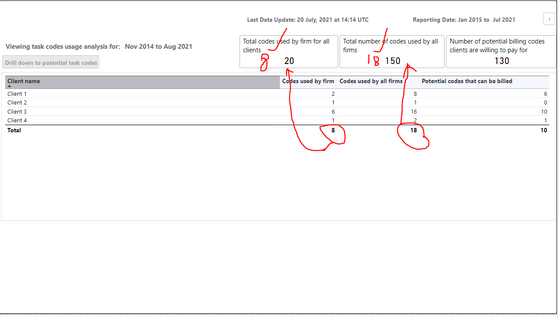
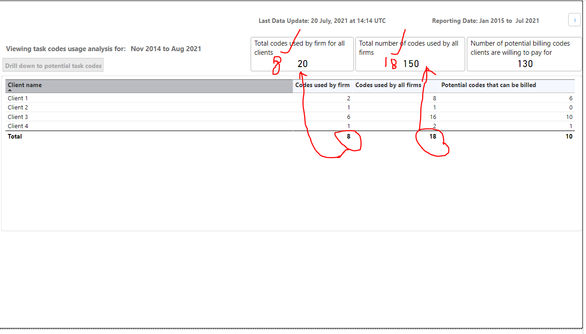
The expected result is as highlighted.
New PBIX:
https://1drv.ms/u/s!AlMdRxAveLesgcFkieztImY35wvHmA?e=7nlkgN
- Mark as New
- Bookmark
- Subscribe
- Mute
- Subscribe to RSS Feed
- Permalink
- Report Inappropriate Content
Hi @Anonymous
try this
*Total producerConsumerTask codes grouped = CALCULATE(DISTINCTCOUNT('report producerConsumerTaskCodes'[TaskCode]),FILTER(Consumer,[*Qualify for taskcode report]="Yes"),FILTER(DimDate,DimDate[Calendar]>=[*Visual start month] && DimDate[Calendar] <= [*Visual end month]
))
*Total ConsumerTask codes grouped = CALCULATE(DISTINCTCOUNT(('report ConsumerTaskCodes'[TaskCode])),FILTER(Consumer,[*Qualify for taskcode report]="Yes"),FILTER(DimDate,DimDate[Calendar]>=[*Visual start month] &&DimDate[Calendar] <= [*Visual end month]
))
Best Regards,
Community Support Team _Tang
If this post helps, please consider Accept it as the solution to help the other members find it more quickly.
- Mark as New
- Bookmark
- Subscribe
- Mute
- Subscribe to RSS Feed
- Permalink
- Report Inappropriate Content
@v-xiaotang v-xiaotang
Unfortunately, the the issue could not be reproduced with the datset sampple. I have a new updated PBIX and screenshot here ....
The expected result is as highlighted.
New PBIX:
https://1drv.ms/u/s!AlMdRxAveLesgcFkieztImY35wvHmA?e=7nlkgN
- Mark as New
- Bookmark
- Subscribe
- Mute
- Subscribe to RSS Feed
- Permalink
- Report Inappropriate Content
Hi @Anonymous
have I soved your question? could you mark my answer as the solution? thx.
Regards,
Community Support Team _Tang
- Mark as New
- Bookmark
- Subscribe
- Mute
- Subscribe to RSS Feed
- Permalink
- Report Inappropriate Content
Hi @Anonymous
try this
*Total producerConsumerTask codes grouped = CALCULATE(DISTINCTCOUNT('report producerConsumerTaskCodes'[TaskCode]),FILTER(Consumer,[*Qualify for taskcode report]="Yes"),FILTER(DimDate,DimDate[Calendar]>=[*Visual start month] && DimDate[Calendar] <= [*Visual end month]
))
*Total ConsumerTask codes grouped = CALCULATE(DISTINCTCOUNT(('report ConsumerTaskCodes'[TaskCode])),FILTER(Consumer,[*Qualify for taskcode report]="Yes"),FILTER(DimDate,DimDate[Calendar]>=[*Visual start month] &&DimDate[Calendar] <= [*Visual end month]
))
Best Regards,
Community Support Team _Tang
If this post helps, please consider Accept it as the solution to help the other members find it more quickly.
- Mark as New
- Bookmark
- Subscribe
- Mute
- Subscribe to RSS Feed
- Permalink
- Report Inappropriate Content
Hi @Anonymous
so what's the expected result of this sample?
in the picture, distinct count of column "Codes used by firm"= 4? and distinct count of column "potential codes that can be billed" = 4? ( I doubt if I understood correctly...😂
Best Regards,
Community Support Team _Tang
If this post helps, please consider Accept it as the solution to help the other members find it more quickly.
Helpful resources

Power BI Dataviz World Championships
The Power BI Data Visualization World Championships is back! Get ahead of the game and start preparing now!

| User | Count |
|---|---|
| 61 | |
| 46 | |
| 40 | |
| 38 | |
| 22 |
| User | Count |
|---|---|
| 178 | |
| 127 | |
| 117 | |
| 77 | |
| 56 |


