Hi All,
I have an issue regarding data modeling. I the issue with 4 tables relationships, 2 dimensions and 1 for facts.
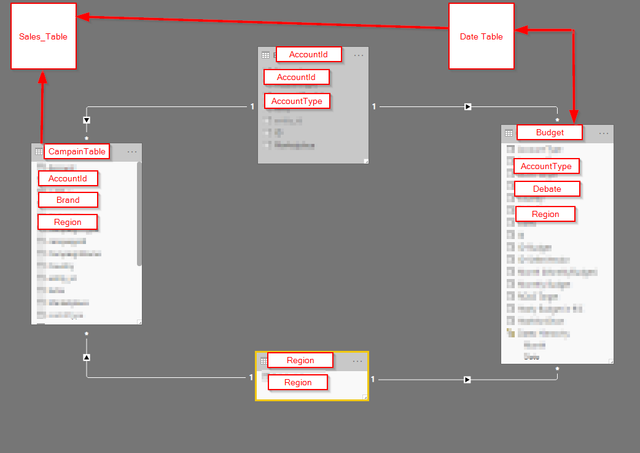
My issue is that we have upgraded our budget table with new categories and the account type for each of these categories. That ruined our previous calculations and for budget vs sales comparison, namely because the brands can't be mapped without creating an extra column and messing up the other relationships. As you can see in the picture, the account table relates to the campaigns table and to the budget, the same for the region. But if I want brands creating a column that might not be filled in the budget table will ruin the relationships.
My questions are:
- Is there another way to create a model that fits our purpose? meaning, filter and calculate by brand, account type, and correct budget and sales.
- Can I create a condition in DAX that allows me to dynamically pass one of the brands to the budget table? if so what other relationship should I create?
I know this subject is hard to explain, please let me know if you need further clarification.
Thanks,
Jorge
FYI @thschr


