Forum Discussion

DAX Running total by another column
Hello,
I need help to create a DAX column/measure that will create a running total by another column.
So for example, looking at this table
 Item  |       Date      |  QTY
----------------------------------
    a    | 12/31/2015 |    1
    a    | 12/31/2015 |    -1
    a    | 12/31/2015 |    2
    b    | 12/31/2015 |    10
    b    | 12/31/2015 |    -5
    b    | 12/31/2015 |    1
What I need at the end is to add another field/column that will create a running total, something like this:
 Item  |       Date      |  QTY  | RunTotal
------------------------------------------------
    a    | 12/31/2014  |    1     |     1
    a    | 1/15/2015    |    -1   |      0
    a    |  2/28/2015   |    2     |     2
    b    | 12/31/2015  |    10   |   10
    b    | 4/6/2015      |    -5   |     5
    b    | 5/5/2015      |    1     |    6
I have tried using a calucalte function and filetering on the date, but it only seems to create a running total for everytihng, not filtering by the item. Similar to this:
On Hand = CALCULATE( SUM('Table'[QTY]),
	FILTER(
		ALL('Table'),
		'Table'[Date] <= MAX('Table'[Date])
	)
)
Any ideas would be much appericated. Thanks for any and all help in advance!
Hello nhanser,
for me it looks like you want to add a calculated column, but the DAX code you use is for beeing used in a pivot table.
I copied your raw data, but used different dates.
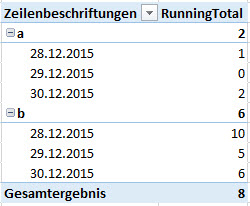
The pivot I created looks like this and I hope this is what you want:
The code I used is close to the one you used, but slightly different:
RunningTotal :=
CALCULATE (
 SUM ( Tabelle1[QTY] );
 FILTER ( ALL ( Tabelle1 ); Tabelle1[Date] <= MAX ( Tabelle1[Date] ) );
 VALUES ( Tabelle1[Item] )
)
The key here is the VALUES() which puts the Items into the filter context of the CALCULATE()-statement. Otherwise you would have running totals on the dates, but it would be the same for all your Items.
Hope that helps a bit.
Greets,
Lars


15 Replies
- LarsSchreiber
Responsive Resident
Hello nhanser,
for me it looks like you want to add a calculated column, but the DAX code you use is for beeing used in a pivot table.
I copied your raw data, but used different dates.
The pivot I created looks like this and I hope this is what you want:
The code I used is close to the one you used, but slightly different:
RunningTotal :=
CALCULATE (
 SUM ( Tabelle1[QTY] );
 FILTER ( ALL ( Tabelle1 ); Tabelle1[Date] <= MAX ( Tabelle1[Date] ) );
 VALUES ( Tabelle1[Item] )
)
The key here is the VALUES() which puts the Items into the filter context of the CALCULATE()-statement. Otherwise you would have running totals on the dates, but it would be the same for all your Items.
Hope that helps a bit.
Greets,
Lars
 robbie337
Advocate I
This is a great solution, thank you. Worth noting you can stack multiple variables in the value cluase to allow aggregation across multiple / different dimensions, (similar to partition by in sql I guess).
However, I have run into a slight issue. If you have a value or combination of values that are empty i.e. there is no row in your dataset for that value or combination of values, the running total becomes incorrect until the next time a row matching those criteria exists, at which point it 'catches up'.
For example, if you are creating a running total of sales by month and team across a year, using a data set like:
Month Team Sales
Jan A 100
Jan B 200
Feb A 150
Feb B 210
Mar A 300
Apr A 120
Apr B 400
In March, if Team B has a month where they have no sales (and therefore no row in the dataset), your running total for the business as a whole will ignore all Team B's previous data in the calculation of a running total, returning 550 as the total, rather than 690.
I'm yet to find a fix for this (despite habving tried every combination of isempty i can think of). If anyone has any ideas I'd love to hear them
RobbieThe following month if Team B has
- Mardin
Advocate IV
Hi robbie337 did you find a solution to your problem?
I have a similar problem, since I want to display my Running Total Measure in a Line Chart and I need to to filter on different categories in a slicer.
If I include my VALUES[Category column] in the Running Total Measure all is fine as long as I ALWAYS have one of the Categories selected in my slicer. If I deselect all in the Category Slicer the Line Chart will jump up and down and not continue to increase as intended.
To fix this I can just leave out the VALUES([Category column] of my Running Total Measure, but then my Running Total would just show an aggregation across all categories and not calculate PER category as intended.
...This is such an easy task in Excel Pivot Tables where Running Total Calculation is a standard option - why is this still missing in PowerBI.
 jmalone
Resolver III
LarsSchreiber - I was looking for a similar solution as nhanser. Your solution worked perfectly!
The key, as you mentioned, is the VALUES() function to put the running total calculation in context of the field needing to be grouped.
Thank you for the very useful response!
- LarsSchreiber
 FawadRehman
Helper I
LarsSchreiber I need your help. I am looking for same solution but somehow its not working for me.
RunningTotal =
CALCULATE (
SUM ( TabelForecast[Forcast] );
FILTER ( ALL ( TabelForecast ); TabelForecast[MonthYear] <= MAX ( TabelForecast[MonthYear] ) );
VALUES ( TabelForecast[M#] )
)I have tried your formula in power BI but its not giving me running total but total for all the rows :( Any suggestions?
- LarsSchreiber
Hi FawadRehman,
sorry, I haven't been here for a while. Could you solve your problem already?!
regards,
Lars
- PowerBIGuy
Have you tried:
On Hand = CALCULATE( SUM('Table'[QTY]),
	FILTER(
		ALLSelected('Table'),
		'Table'[Date] <= MAX('Table'[Date])
	)
)
