Forum Discussion

 Advocate IV
DAX: How to perform a cummulative summation

- 10 years ago
First you need to have a seperate date table in order to perfom date calculations...
Step 1 : Create a date table -> Go to Modelling click New Table -> enter Dates = CALENDARAUTO()..Now you have a date table call Dates..-> New Column in this table Month = MONTH(Dates[Date])
Step 2 : Create Relantionship between your yourtable[Dates] ( the new only dates you created ) and Dates[Date] ( the calculated table)
Step 3 : Rewrite your formula to Measure = CALCULATE(
SUM(rprtsolarhistorical[Daily Output]);
FILTER(
ALL(Dates[Dates]);
Dates[Date]) <= MAX(Dates[Date])
)
)Step 4: add the months field from the new Dates table and the "measure"
Hope this works


 Responsive Resident
HI konstantinos looks like you are right on it. I had also used the great answer for cumulative totals at Dax Patterns http://www.daxpatterns.com/cumulative-total/
But I need to have my cumulative running over the same year. Have each year overlaying the others. To do this I figure I need a date column that calcuates what day of the year it is (ignoring the actual year) rather than an actual date
At the moment I am getting this
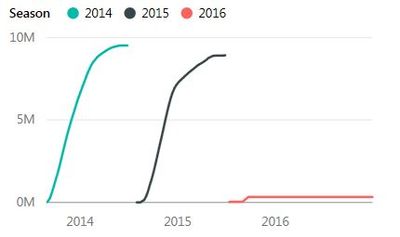
But want it to look more like this.
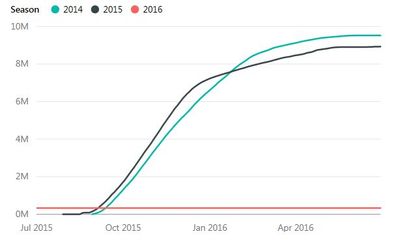
any help you could give would be greatly appreciated.
Cheers.

 Memorable Member
elliotdixon not sure I understand..Sorry..do you need to compare all years in one graph? like current year - previous etc..or you need a lifetime value..What you would have in axis - months ?
- konstantinos10 years ago
elliotdixon An approach ( maybe not the best one - but I don't work much with fiscal dates ) maybe
YTD Current Fiscal = TOTALYTD(SUM(Sales[Amount);'Dates'[Date];"6-30") - The last one is for specifying the end of year ( Fiscal )
Previous YTD Fiscal = CALCULATE([YTD Current Fiscal];DATEADD('Dates'[Date];-1;YEAR))
2 Years Before YTD = CALCULATE([YTD Current Fiscal];DATEADD('Dates'[Date];-2;YEAR))
This way you can have any fiscal year dates in axis and compare all of them..Also can slice on Years
axis = fiscal year 2015 will show also 2014 & 2013
axis = fiscal year 2013 will show also 2012 & 2011
Hope it works..
- elliotdixon10 years ago
Hi konstantinos Cheers - I want to show all the years on the same graph. One line for each different year. The axis is our season (just a financial year - 1st July to 30th June)
Cheers.
 Haegi10 years ago
Advocate V
Hi, I faced the same case.
First i suppose you hae a Date table with column Date (complete), Year, Month etc..
I created new measure column like this
CumulativeYear =
CALCULATE(
SUM('Aggregate'[Amount]);
FILTER(ALL(Dates[Year]); Dates[Year] = MAX(Dates[Year]));
FILTER(ALL(Dates[Month]); Dates[Month] <= MAX(Dates[Month])))
I use two filter to specify a particular context: for each year you parse all month.
- elliotdixon10 years ago
Hi Haegi
Thanks for the help. I can create the measure with no errors but cannot then bring it into any table or graph??
Get an error
"MdxScript(Model) (2, 43) Calculation error in measure 'InvoiceDetail'[CumulativeYear]: The function MAX takes an argument that evaluates to numbers or dates and cannot work with values of type String."My code is.
CumulativeYear = CALCULATE(SUM(InvoiceDetail[DETAIL_KMS_TOCHARGE]),
FILTER(ALL(Dates[Year]),Dates[Year] = MAX(Dates[Year])),
FILTER(ALL(Dates[MonthName]),Dates[MonthName] <= MAX(Dates[MonthName])))
Same result if I remove out the Month filters and just have one on the years.
- Haegi10 years ago
Good job!
This error explain that MAX function doesnt work with String value.
I suppose the column 'MonthName' is a string like "January" or "Febuary", we must instead use integer value like 1,2,3,4,5 etc..
for the Month column.
Regards.