Fabric Data Days starts November 4th!
Advance your Data & AI career with 50 days of live learning, dataviz contests, hands-on challenges, study groups & certifications and more!
Get registered- Power BI forums
- Get Help with Power BI
- Desktop
- Service
- Report Server
- Power Query
- Mobile Apps
- Developer
- DAX Commands and Tips
- Custom Visuals Development Discussion
- Health and Life Sciences
- Power BI Spanish forums
- Translated Spanish Desktop
- Training and Consulting
- Instructor Led Training
- Dashboard in a Day for Women, by Women
- Galleries
- Data Stories Gallery
- Themes Gallery
- Contests Gallery
- Quick Measures Gallery
- Visual Calculations Gallery
- Notebook Gallery
- Translytical Task Flow Gallery
- TMDL Gallery
- R Script Showcase
- Webinars and Video Gallery
- Ideas
- Custom Visuals Ideas (read-only)
- Issues
- Issues
- Events
- Upcoming Events
Get Fabric Certified for FREE during Fabric Data Days. Don't miss your chance! Learn more
- Power BI forums
- Forums
- Get Help with Power BI
- Desktop
- Re: Cumulative measure and empty legend in barchar...
- Subscribe to RSS Feed
- Mark Topic as New
- Mark Topic as Read
- Float this Topic for Current User
- Bookmark
- Subscribe
- Printer Friendly Page
- Mark as New
- Bookmark
- Subscribe
- Mute
- Subscribe to RSS Feed
- Permalink
- Report Inappropriate Content
Cumulative measure and empty legend in barchart
Hello !
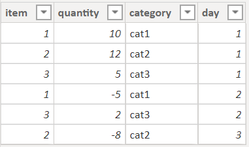
I am currently working on a inventory dashboard. I have a transaction table (day, item, category, quantity) like this one

And I would like to display the inventory value per category for each day.
I have created a cumulated measure to compute the total inventory per day:
cumulated_quantity =
CALCULATE(
	SUM('transactions'[quantity]),
	FILTER(
		ALLSELECTED('transactions'[day]),
		ISONORAFTER('transactions'[day], MAX('transactions'[day]), DESC)
	)
)
When I display the full inventory per day I see the expected result (day 1: 27, day 2: 24, day 3: 16)

But when I apply the category as a legend, I notice that if there is no transaction for a given day and category, the category is not displayed in the chart:
day 1: 27 , day 2: 12, day 3: 4

How can I do to display the correct inventory for those days ?
Thanks for your help !
Solved! Go to Solution.
- Mark as New
- Bookmark
- Subscribe
- Mute
- Subscribe to RSS Feed
- Permalink
- Report Inappropriate Content
Hi @phaidara ,
You will need to create an extra category table with no relationship with transactions table.
category = DISTINCT(transactions[category])Then use below formula to get the result.
Measure = CALCULATE(SUM(transactions[quantity]),FILTER(ALLSELECTED(transactions),transactions[day]<=MAX(transactions[day])&&transactions[category]=SELECTEDVALUE('category'[category])))
Best Regards,
Jay
- Mark as New
- Bookmark
- Subscribe
- Mute
- Subscribe to RSS Feed
- Permalink
- Report Inappropriate Content
Hi @phaidara ,
You will need to create an extra category table with no relationship with transactions table.
category = DISTINCT(transactions[category])Then use below formula to get the result.
Measure = CALCULATE(SUM(transactions[quantity]),FILTER(ALLSELECTED(transactions),transactions[day]<=MAX(transactions[day])&&transactions[category]=SELECTEDVALUE('category'[category])))
Best Regards,
Jay
- Mark as New
- Bookmark
- Subscribe
- Mute
- Subscribe to RSS Feed
- Permalink
- Report Inappropriate Content
Hey @Anonymous !
Thanks a lot, it is exactly what I was looking for !
- Mark as New
- Bookmark
- Subscribe
- Mute
- Subscribe to RSS Feed
- Permalink
- Report Inappropriate Content
@phaidara , Try like
cumulated_quantity =
CALCULATE(
SUM('transactions'[quantity]),
FILTER(
ALLSELECTED('transactions'),
'transactions'[day]>= max('transactions'[day])
&& 'transactions'[category]= max('transactions'[category])
)
)
- Mark as New
- Bookmark
- Subscribe
- Mute
- Subscribe to RSS Feed
- Permalink
- Report Inappropriate Content
Hi @amitchandak !
Thank you for your quick reply !
I've tried your solution but it does not seem to work.
Here is the new result that i got when i copied:
Helpful resources

Fabric Data Days
Advance your Data & AI career with 50 days of live learning, contests, hands-on challenges, study groups & certifications and more!

Power BI Monthly Update - October 2025
Check out the October 2025 Power BI update to learn about new features.


