- Power BI forums
- Updates
- News & Announcements
- Get Help with Power BI
- Desktop
- Service
- Report Server
- Power Query
- Mobile Apps
- Developer
- DAX Commands and Tips
- Custom Visuals Development Discussion
- Health and Life Sciences
- Power BI Spanish forums
- Translated Spanish Desktop
- Power Platform Integration - Better Together!
- Power Platform Integrations (Read-only)
- Power Platform and Dynamics 365 Integrations (Read-only)
- Training and Consulting
- Instructor Led Training
- Dashboard in a Day for Women, by Women
- Galleries
- Community Connections & How-To Videos
- COVID-19 Data Stories Gallery
- Themes Gallery
- Data Stories Gallery
- R Script Showcase
- Webinars and Video Gallery
- Quick Measures Gallery
- 2021 MSBizAppsSummit Gallery
- 2020 MSBizAppsSummit Gallery
- 2019 MSBizAppsSummit Gallery
- Events
- Ideas
- Custom Visuals Ideas
- Issues
- Issues
- Events
- Upcoming Events
- Community Blog
- Power BI Community Blog
- Custom Visuals Community Blog
- Community Support
- Community Accounts & Registration
- Using the Community
- Community Feedback
Register now to learn Fabric in free live sessions led by the best Microsoft experts. From Apr 16 to May 9, in English and Spanish.
- Power BI forums
- Forums
- Get Help with Power BI
- Desktop
- Cumulative count by category and date
- Subscribe to RSS Feed
- Mark Topic as New
- Mark Topic as Read
- Float this Topic for Current User
- Bookmark
- Subscribe
- Printer Friendly Page
- Mark as New
- Bookmark
- Subscribe
- Mute
- Subscribe to RSS Feed
- Permalink
- Report Inappropriate Content
Cumulative count by category and date
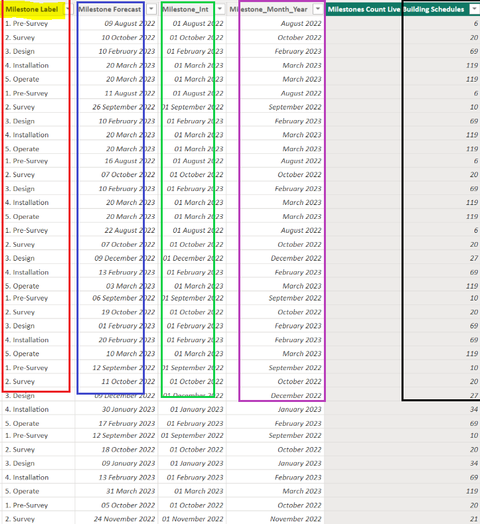
Hi Everyone, I have been scrolling for a few days, but I must turn it in here as I need a solution to match my search. I have a few columns I unpivoted to obtain a single column of the different categories I wanted to report. These categories are milestones that will be achieved throughout dated periods. I want to create a cumulative count by category that groups the counts of those milestones by category occurring in the same month. The picture reflects the source data from which I want to achieve this.
🔺[Milestones Label]: Column I want to report separately
🔹[Milestones Forecast]: Real date of occurrence
💚[Milestones Int]: all milestones are formatted to the 1st of each month. Thought to be needed for monthly cumulative count.
💜[Milestones_Month_Year]: The column use as table headers to report the cumulative count by category
◼️[Milestones Count Live Building Schedules]: Cumulative counts values
Here is the excel table with the milestones cumulative count by date I am trying to achieve in powerbi:
Here the formula among others I have tried so far with no success
Thank you so much in advance!
Solved! Go to Solution.
- Mark as New
- Bookmark
- Subscribe
- Mute
- Subscribe to RSS Feed
- Permalink
- Report Inappropriate Content
@charlie_torres , Try to use window function
Power BI Window function Rolling, Cumulative/Running Total, WTD, MTD, QTD, YTD, FYTD: https://youtu.be/nxc_IWl-tTc
You can also use date table and measure like
Cumm Sales = CALCULATE(SUM(Sales[Sales Amount]),filter(all('Date'),'Date'[date] <=max('Date'[date])))
Cumm Sales = CALCULATE(SUM(Sales[Sales Amount]),filter(allselected(date),date[date] <=max(date[Date])))
Running Total/ Cumulative: https://www.youtube.com/watch?v=h2wsO332LUo&list=PLPaNVDMhUXGaaqV92SBD5X2hk3TMNlHhb&index=41
Microsoft Power BI Learning Resources, 2023 !!
Learn Power BI - Full Course with Dec-2022, with Window, Index, Offset, 100+ Topics !!
Did I answer your question? Mark my post as a solution! Appreciate your Kudos !! Proud to be a Super User! !!
- Mark as New
- Bookmark
- Subscribe
- Mute
- Subscribe to RSS Feed
- Permalink
- Report Inappropriate Content
Your suggestion was the right solution. I just realized there were missing dates, which is why the figures didn't match on the first try. It is all sorted now. Thank you so much @amitchandak .
- Mark as New
- Bookmark
- Subscribe
- Mute
- Subscribe to RSS Feed
- Permalink
- Report Inappropriate Content
Hi @amitchandak
This was of great help. I checked both videos, and following this guidance, I am the closest I have ever been to achieving this. However, the examples here mainly focus on adding cumulative sales values. In my case, I am looking to add a cumulative by-date of milestones by category, meaning that I need to add labels sharing the exact date. Therefore the count increments by date but differs among labels. So far, I have come out with this formula:
Rolling 12 = CALCULATE(COUNT('140 Milestones Draft'[Milestone Label]), WINDOW(0, ABS, 0, REL, ALLSELECTED( '140 Milestones Draft'[Milestone Label], '140 Milestones Draft'[Milestone_Int]), ORDERBY('140 Milestones Draft'[Milestone_Int])))
Result:
Not quite there yet.
- Mark as New
- Bookmark
- Subscribe
- Mute
- Subscribe to RSS Feed
- Permalink
- Report Inappropriate Content
@charlie_torres , Try to use window function
Power BI Window function Rolling, Cumulative/Running Total, WTD, MTD, QTD, YTD, FYTD: https://youtu.be/nxc_IWl-tTc
You can also use date table and measure like
Cumm Sales = CALCULATE(SUM(Sales[Sales Amount]),filter(all('Date'),'Date'[date] <=max('Date'[date])))
Cumm Sales = CALCULATE(SUM(Sales[Sales Amount]),filter(allselected(date),date[date] <=max(date[Date])))
Running Total/ Cumulative: https://www.youtube.com/watch?v=h2wsO332LUo&list=PLPaNVDMhUXGaaqV92SBD5X2hk3TMNlHhb&index=41
Microsoft Power BI Learning Resources, 2023 !!
Learn Power BI - Full Course with Dec-2022, with Window, Index, Offset, 100+ Topics !!
Did I answer your question? Mark my post as a solution! Appreciate your Kudos !! Proud to be a Super User! !!
Helpful resources

Microsoft Fabric Learn Together
Covering the world! 9:00-10:30 AM Sydney, 4:00-5:30 PM CET (Paris/Berlin), 7:00-8:30 PM Mexico City

Power BI Monthly Update - April 2024
Check out the April 2024 Power BI update to learn about new features.

| User | Count |
|---|---|
| 106 | |
| 94 | |
| 77 | |
| 65 | |
| 53 |
| User | Count |
|---|---|
| 147 | |
| 106 | |
| 104 | |
| 87 | |
| 61 |


