Fabric Data Days starts November 4th!
Advance your Data & AI career with 50 days of live learning, dataviz contests, hands-on challenges, study groups & certifications and more!
Get registered- Power BI forums
- Get Help with Power BI
- Desktop
- Service
- Report Server
- Power Query
- Mobile Apps
- Developer
- DAX Commands and Tips
- Custom Visuals Development Discussion
- Health and Life Sciences
- Power BI Spanish forums
- Translated Spanish Desktop
- Training and Consulting
- Instructor Led Training
- Dashboard in a Day for Women, by Women
- Galleries
- Data Stories Gallery
- Themes Gallery
- Contests Gallery
- QuickViz Gallery
- Quick Measures Gallery
- Visual Calculations Gallery
- Notebook Gallery
- Translytical Task Flow Gallery
- TMDL Gallery
- R Script Showcase
- Webinars and Video Gallery
- Ideas
- Custom Visuals Ideas (read-only)
- Issues
- Issues
- Events
- Upcoming Events
Get Fabric Certified for FREE during Fabric Data Days. Don't miss your chance! Request now
- Power BI forums
- Forums
- Get Help with Power BI
- Desktop
- Re: Creating a line chart with a dynamic total lin...
- Subscribe to RSS Feed
- Mark Topic as New
- Mark Topic as Read
- Float this Topic for Current User
- Bookmark
- Subscribe
- Printer Friendly Page

- Mark as New
- Bookmark
- Subscribe
- Mute
- Subscribe to RSS Feed
- Permalink
- Report Inappropriate Content
Creating a line chart with a dynamic total line
Hello,
I'm creating a line chart that graphs the total amount of downloads by region over a period of time. The X-axis is the date, formated like MMM-YYYY. The Y-axis is the number of downloads. Each line on the graph represents a specific region, such as Americas, China, India, etc. In addition to the regions, I need a line that represents the Total amount of downloads. I have one table from a database (Table1). The only columns of the table that are relevant to this graph are Date and Region.
I have also created a calculated table that contains a single column of all unique regions, with an added row for "Total". There is no relationship between the two tables. It is created as follows:
Total = UNION ( VALUES (Table1[Region] ), ROW ( "Total", "Total" ) )
I created a Measure for Table1:
Measure =
VAR _CurrentAxis = SELECTEDVALUE(Total[Region])
RETURN
IF( _CurrentAxis = "Total",
CALCULATE( COUNT(Table1[Region]), VALUES(Total[Region]) ),
CALCULATE( COUNT(Table1[Region]), Table1[Region] = _CurrentAxis ) )
In the report itself, for the linechart I marked the following fields as such:
Axis: Table1[Date]
Legend: Total[Region]
Values: Table1[Measure]
I also created a Slicer:
Field: Total[Region]
Now, here lies the problem. When I select which regions to display in the slicer, everything displays correctly and as expected except for the total line. The total line shows the total number of downloads of all regions, regardless if they are selected in the slicer or not. I want this total line to dynamically graph the total based on what is selected in the slicer.
I suspect the problem lies within the filter of CALCULATE in this line of the Measure:
CALCULATE( COUNT(Table1[Region]), VALUES(Total[Region]) ),
I tried a few ways to alter this line to no avail. Essentially, I think I need to filter with something along the lines of below, but I don't know how to do that within DAX.
foreach value in VALUES(Total[Region]) { Table1[Region] = value }
Am I going about this the wrong way and is there actually a much simpler approach, or is there something else that I'm missing to get the Total line in my line chart to dynamically graph based on slicer selections?
Solved! Go to Solution.


- Mark as New
- Bookmark
- Subscribe
- Mute
- Subscribe to RSS Feed
- Permalink
- Report Inappropriate Content
@Anonymous solution attached.
@edhans , not sure if not having that function I'm missing anything. Never had a need for it but it can be surely handy.
Check my latest blog post Comparing Selected Client With Other Top N Clients | PeryTUS I would ❤ Kudos if my solution helped. 👉 If you can spend time posting the question, you can also make efforts to give Kudos to whoever helped to solve your problem. It is a token of appreciation!
⚡Visit us at https://perytus.com, your one-stop-shop for Power BI-related projects/training/consultancy.⚡
Subscribe to the @PowerBIHowTo YT channel for an upcoming video on List and Record functions in Power Query!!
Learn Power BI and Fabric - subscribe to our YT channel - Click here: @PowerBIHowTo
If my solution proved useful, I'd be delighted to receive Kudos. When you put effort into asking a question, it's equally thoughtful to acknowledge and give Kudos to the individual who helped you solve the problem. It's a small gesture that shows appreciation and encouragement! ❤
Did I answer your question? Mark my post as a solution. Proud to be a Super User! Appreciate your Kudos 🙂
Feel free to email me with any of your BI needs.
- Mark as New
- Bookmark
- Subscribe
- Mute
- Subscribe to RSS Feed
- Permalink
- Report Inappropriate Content
@Anonymous I'm not clear what was not working and with change what started working. Can you explain? I want to understand. It is not clear why it wouldn't work until you have different requirements/expectations.
Subscribe to the @PowerBIHowTo YT channel for an upcoming video on List and Record functions in Power Query!!
Learn Power BI and Fabric - subscribe to our YT channel - Click here: @PowerBIHowTo
If my solution proved useful, I'd be delighted to receive Kudos. When you put effort into asking a question, it's equally thoughtful to acknowledge and give Kudos to the individual who helped you solve the problem. It's a small gesture that shows appreciation and encouragement! ❤
Did I answer your question? Mark my post as a solution. Proud to be a Super User! Appreciate your Kudos 🙂
Feel free to email me with any of your BI needs.
- Mark as New
- Bookmark
- Subscribe
- Mute
- Subscribe to RSS Feed
- Permalink
- Report Inappropriate Content
@parry2k I apologize, I just retested your solution and it worked for me. I think I might have initially replaced one of the tables incorrectly when I first tried it. I will mark your reply as the correct solution! Thank you
- Mark as New
- Bookmark
- Subscribe
- Mute
- Subscribe to RSS Feed
- Permalink
- Report Inappropriate Content
@Anonymous solution attached.
@edhans , not sure if not having that function I'm missing anything. Never had a need for it but it can be surely handy.
Check my latest blog post Comparing Selected Client With Other Top N Clients | PeryTUS I would ❤ Kudos if my solution helped. 👉 If you can spend time posting the question, you can also make efforts to give Kudos to whoever helped to solve your problem. It is a token of appreciation!
⚡Visit us at https://perytus.com, your one-stop-shop for Power BI-related projects/training/consultancy.⚡
Subscribe to the @PowerBIHowTo YT channel for an upcoming video on List and Record functions in Power Query!!
Learn Power BI and Fabric - subscribe to our YT channel - Click here: @PowerBIHowTo
If my solution proved useful, I'd be delighted to receive Kudos. When you put effort into asking a question, it's equally thoughtful to acknowledge and give Kudos to the individual who helped you solve the problem. It's a small gesture that shows appreciation and encouragement! ❤
Did I answer your question? Mark my post as a solution. Proud to be a Super User! Appreciate your Kudos 🙂
Feel free to email me with any of your BI needs.
- Mark as New
- Bookmark
- Subscribe
- Mute
- Subscribe to RSS Feed
- Permalink
- Report Inappropriate Content
I am creating line chart that shows units sold by location over the period of time. I wanted to add dynamic total line that should shoe total of filtered location units sold and if there is no filter then it should show total units for all location. how can I do that?
- Mark as New
- Bookmark
- Subscribe
- Mute
- Subscribe to RSS Feed
- Permalink
- Report Inappropriate Content
@parry2k Thank you so much for your help! Your solution didn't work exactly for my case, but it was very close. With some minor tweaks based on your answer, the issue I was having is resolved.
Create a measure of Total Sales
Total Sales = COUNT ( Table1[Region] )
Create a measure for Selected Sales to be used in Values of the line chart:
Selected Sales =
VAR _CurrentAxis = SELECTEDVALUE(Total[Region])

return
IF (  _CurrentAxis  = "Total",
    CALCULATE (
        [Total Sales],
        TREATAS ( ALLSELECTED ( Total[Region] ), Table1[Region] )
    ),
     CALCULATE(
        COUNT(Table1[Region]),
        Table1[Region] = _CurrentAxis
    )
)
EDIT: @parry2k did have the correct solution, it was my mistake in copying it over to my own file. Please see their solution
- Mark as New
- Bookmark
- Subscribe
- Mute
- Subscribe to RSS Feed
- Permalink
- Report Inappropriate Content
@Anonymous I guess this is what you are looking for:
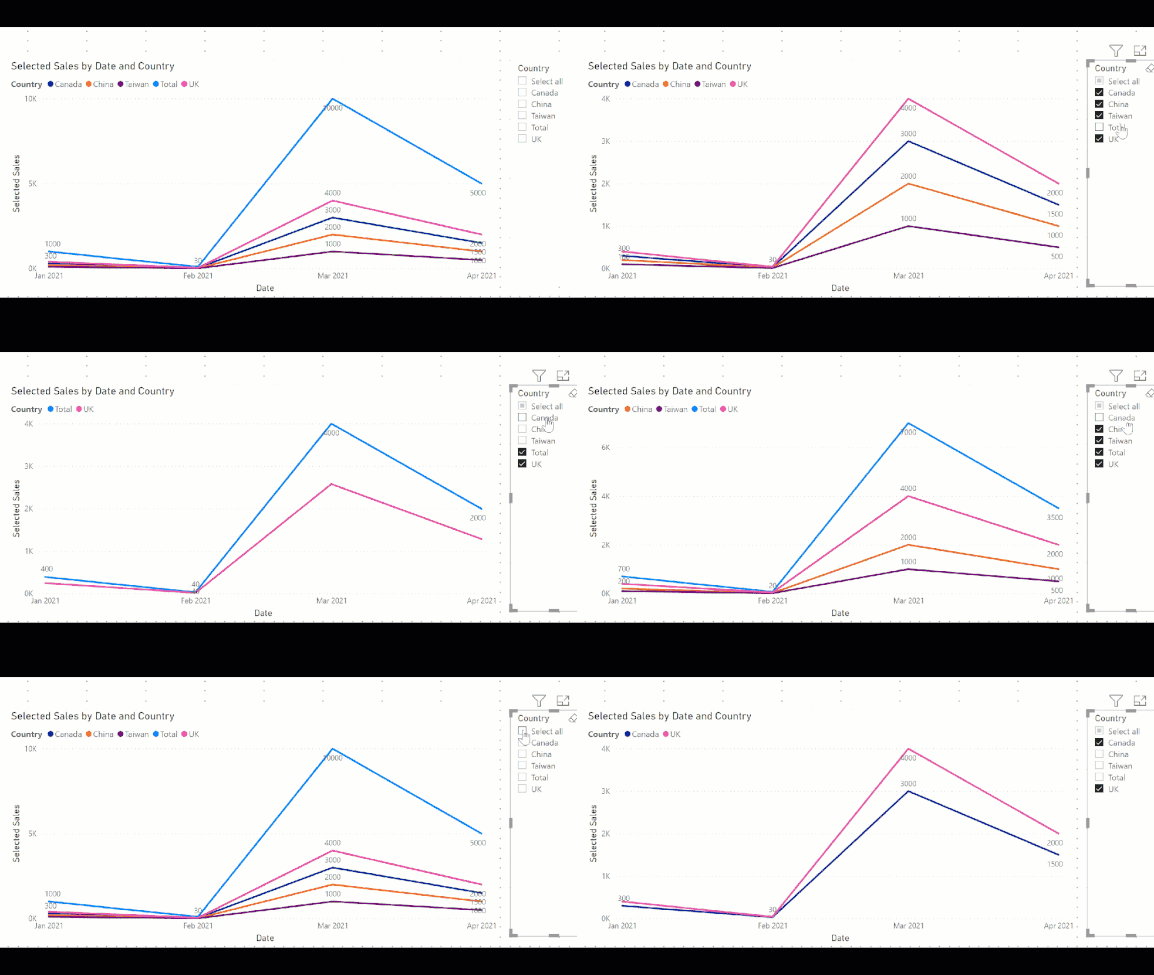
Subscribe to the @PowerBIHowTo YT channel for an upcoming video on List and Record functions in Power Query!!
Learn Power BI and Fabric - subscribe to our YT channel - Click here: @PowerBIHowTo
If my solution proved useful, I'd be delighted to receive Kudos. When you put effort into asking a question, it's equally thoughtful to acknowledge and give Kudos to the individual who helped you solve the problem. It's a small gesture that shows appreciation and encouragement! ❤
Did I answer your question? Mark my post as a solution. Proud to be a Super User! Appreciate your Kudos 🙂
Feel free to email me with any of your BI needs.
- Mark as New
- Bookmark
- Subscribe
- Mute
- Subscribe to RSS Feed
- Permalink
- Report Inappropriate Content
Yes, that is exactly what I am looking for
- Mark as New
- Bookmark
- Subscribe
- Mute
- Subscribe to RSS Feed
- Permalink
- Report Inappropriate Content
@Anonymous Is this what you are looking for, basically select the values in the slicer and always show the total of the selected points, as shown in the video below:
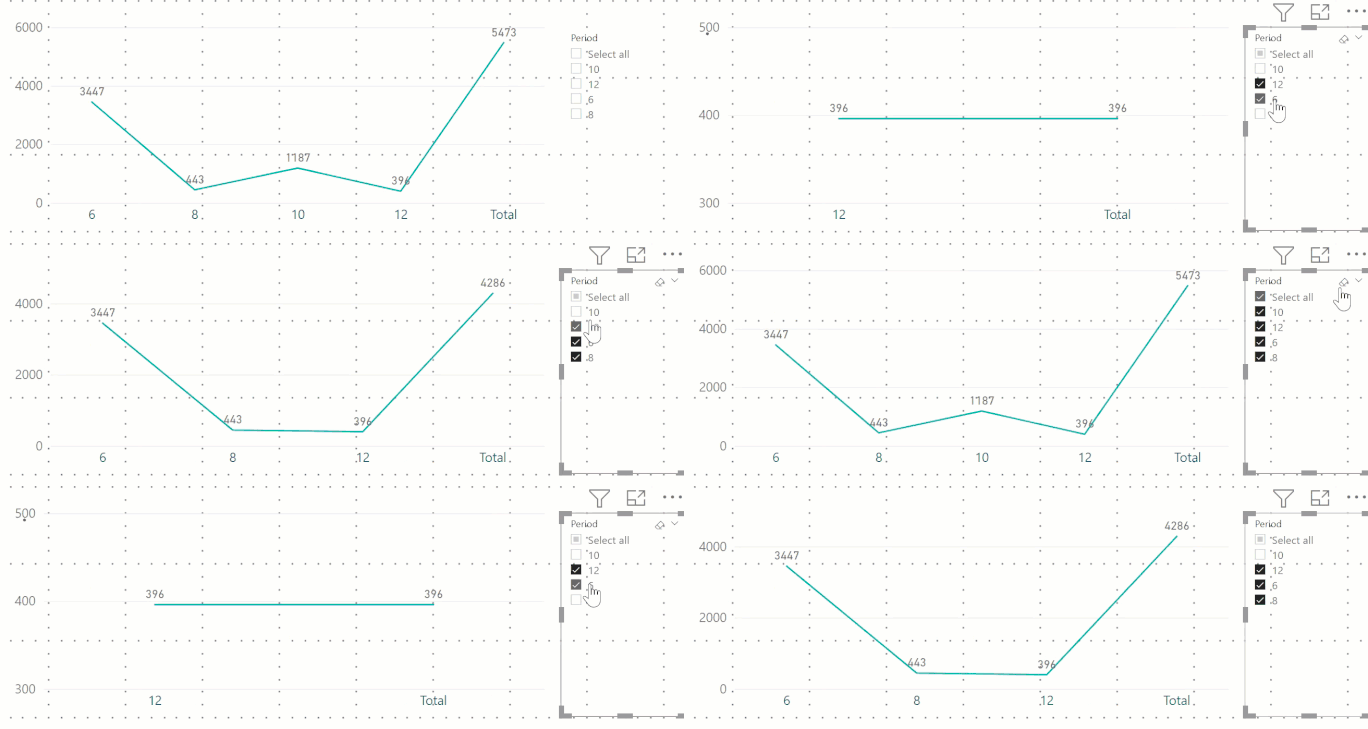
Subscribe to the @PowerBIHowTo YT channel for an upcoming video on List and Record functions in Power Query!!
Learn Power BI and Fabric - subscribe to our YT channel - Click here: @PowerBIHowTo
If my solution proved useful, I'd be delighted to receive Kudos. When you put effort into asking a question, it's equally thoughtful to acknowledge and give Kudos to the individual who helped you solve the problem. It's a small gesture that shows appreciation and encouragement! ❤
Did I answer your question? Mark my post as a solution. Proud to be a Super User! Appreciate your Kudos 🙂
Feel free to email me with any of your BI needs.
- Mark as New
- Bookmark
- Subscribe
- Mute
- Subscribe to RSS Feed
- Permalink
- Report Inappropriate Content
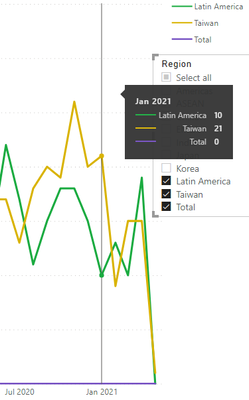
Not quite. Each selected value in the slicer should be it's own line. Total should also be an option in the slicer, and if that is selected, it takes the total of everything else selected and graphs that in addition to the other lines.
In my picture below, it should graph the count of Latin America and Taiwan over a date range. Total is the purple line and it is flat at 0, which is incorrect. For Jan 2021, the total should be at 31 (10 + 21).
- Mark as New
- Bookmark
- Subscribe
- Mute
- Subscribe to RSS Feed
- Permalink
- Report Inappropriate Content
@edhans I hope this small video will help with the solution and here is the DAX code:
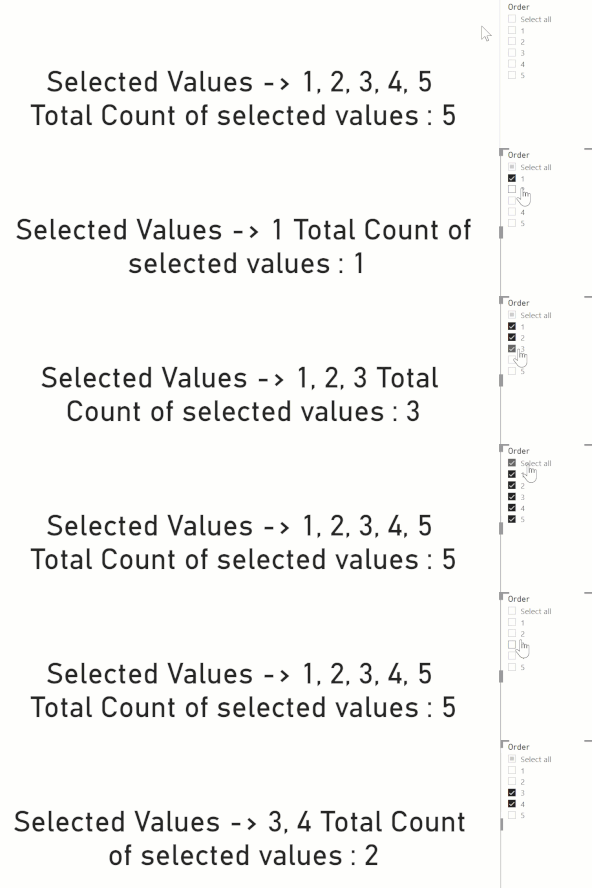
Selected Order =
VAR __values = VALUES ( 'Order'[Order] )
RETURN
"Selected Values -> " &
    CONCATENATEX (
        __values,
        [Order],
        ", "
) &
" Total Count of selected values : " &
    FORMAT (
        COUNTROWS ( __values ),
        "General Number"
    )
Subscribe to the @PowerBIHowTo YT channel for an upcoming video on List and Record functions in Power Query!!
Learn Power BI and Fabric - subscribe to our YT channel - Click here: @PowerBIHowTo
If my solution proved useful, I'd be delighted to receive Kudos. When you put effort into asking a question, it's equally thoughtful to acknowledge and give Kudos to the individual who helped you solve the problem. It's a small gesture that shows appreciation and encouragement! ❤
Did I answer your question? Mark my post as a solution. Proud to be a Super User! Appreciate your Kudos 🙂
Feel free to email me with any of your BI needs.

- Mark as New
- Bookmark
- Subscribe
- Mute
- Subscribe to RSS Feed
- Permalink
- Report Inappropriate Content
Right @parry2k - first of all thanks for jumping in with the follow up for @Anonymous as I would have had to start over.
But my point was, and your video shows it, if you select 5 items, or 0 items, the measure shows 5 selected. Because VALUES(Table[Field]) shows the same with none or all of the items in the field are selected. That may or may not have any impact on this solution. It is just a frustrating thing. I am to sure how to detect none are selected, because DAX shows the same results as when all are selected. No distinction from the slicer's point of view. I know when you select none, it shows all, so treats it as all. Still. No COUNTCHECKBOXESINSLICER() function exists. 😀
Did I answer your question? Mark my post as a solution!
Did my answers help arrive at a solution? Give it a kudos by clicking the Thumbs Up!
DAX is for Analysis. Power Query is for Data Modeling
Proud to be a Super User!
MCSA: BI Reporting- Mark as New
- Bookmark
- Subscribe
- Mute
- Subscribe to RSS Feed
- Permalink
- Report Inappropriate Content
@Anonymous change @edhans code to use multiple selection:
count =
VAR varSelectedValueTable = VALUES('Table (2)'[Column1])
//VAR varSelectedValueTable = { varSelectedValue }
VAR varFilteredTable =
    FILTER(
        'Table',
        'Table'[Column1] in varSelectedValueTable
    )
VAR varTotalCount =
    CALCULATE(
        COUNTROWS('Table'),
        KEEPFILTERS('Table'[Column1] in varSelectedValueTable)
    )
VAR Result = COALESCE(varTotalCount, 0)
RETURN
    Result
Check my latest blog post Comparing Selected Client With Other Top N Clients | PeryTUS I would ❤ Kudos if my solution helped. 👉 If you can spend time posting the question, you can also make efforts to give Kudos to whoever helped to solve your problem. It is a token of appreciation!
⚡Visit us at https://perytus.com, your one-stop-shop for Power BI-related projects/training/consultancy.⚡
Subscribe to the @PowerBIHowTo YT channel for an upcoming video on List and Record functions in Power Query!!
Learn Power BI and Fabric - subscribe to our YT channel - Click here: @PowerBIHowTo
If my solution proved useful, I'd be delighted to receive Kudos. When you put effort into asking a question, it's equally thoughtful to acknowledge and give Kudos to the individual who helped you solve the problem. It's a small gesture that shows appreciation and encouragement! ❤
Did I answer your question? Mark my post as a solution. Proud to be a Super User! Appreciate your Kudos 🙂
Feel free to email me with any of your BI needs.
- Mark as New
- Bookmark
- Subscribe
- Mute
- Subscribe to RSS Feed
- Permalink
- Report Inappropriate Content
Correct me if I am wrong @parry2k but with that code, if nothing is selected, isn't everything selected? That might be what @Anonymous wants, but I do not think that will return nothing if no slicer selections are made.
Did I answer your question? Mark my post as a solution!
Did my answers help arrive at a solution? Give it a kudos by clicking the Thumbs Up!
DAX is for Analysis. Power Query is for Data Modeling
Proud to be a Super User!
MCSA: BI Reporting- Mark as New
- Bookmark
- Subscribe
- Mute
- Subscribe to RSS Feed
- Permalink
- Report Inappropriate Content
@edhans, @parry2k: If nothing is selected, then I am ok with "everything" being selected.
Thank you both for helping me solve this issue. The count is now showing correctly, but there is another issue which my post asks. Getting this to properly show on a line chart. When I try to graph this, the total is 0 despite the count.

- Mark as New
- Bookmark
- Subscribe
- Mute
- Subscribe to RSS Feed
- Permalink
- Report Inappropriate Content
Here is one way to do at @Anonymous
count =
VAR varSelectedValue = SELECTEDVALUE('Table (2)'[Column1])
VAR varSelectedValueTable = { varSelectedValue }
VAR varFilteredTable =
    FILTER(
        'Table',
        'Table'[Column1] in varSelectedValueTable
    )
VAR varTotalCount =
    CALCULATE(
        COUNTROWS('Table'),
        KEEPFILTERS('Table'[Column1] in varSelectedValueTable)
    )
VAR Result = COALESCE(varTotalCount, 0)
RETURN
    Result
What this does is it takes the Selected Value from your slicer table (disconnected) and turns it back into a table - that is what the {} syntax does. I then added a bit more logic so it returns 0 for those values not selected, not a blank.
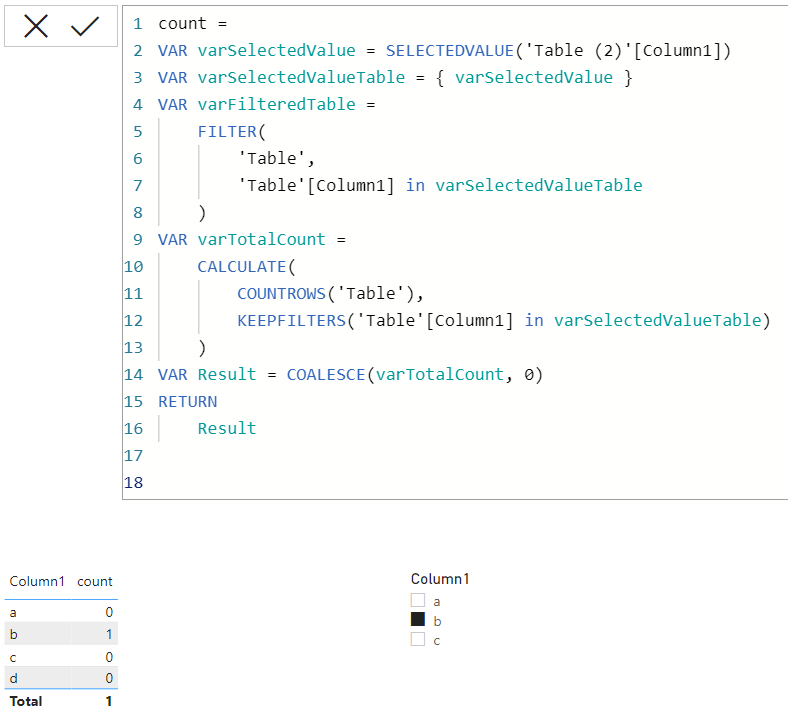
Then I count the rows in the main table where the values in column 1 of that table exist in the table created from the slicer selection.
Did I answer your question? Mark my post as a solution!
Did my answers help arrive at a solution? Give it a kudos by clicking the Thumbs Up!
DAX is for Analysis. Power Query is for Data Modeling
Proud to be a Super User!
MCSA: BI Reporting- Mark as New
- Bookmark
- Subscribe
- Mute
- Subscribe to RSS Feed
- Permalink
- Report Inappropriate Content
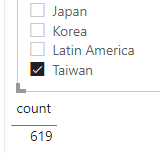
I only get a count if one value is selected in the slicer. If multiple values are selected, the count is 0, which is undesirable. I need to be able to select mutiple values at the same time and get the total count for all of them.

- Mark as New
- Bookmark
- Subscribe
- Mute
- Subscribe to RSS Feed
- Permalink
- Report Inappropriate Content
Ok, that would have been really helpful to know in the original post. Unfortunately I didn't save my work so I will have to circle back to this later.
Did I answer your question? Mark my post as a solution!
Did my answers help arrive at a solution? Give it a kudos by clicking the Thumbs Up!
DAX is for Analysis. Power Query is for Data Modeling
Proud to be a Super User!
MCSA: BI Reporting
Helpful resources

Power BI Monthly Update - November 2025
Check out the November 2025 Power BI update to learn about new features.

Fabric Data Days
Advance your Data & AI career with 50 days of live learning, contests, hands-on challenges, study groups & certifications and more!

FabCon Atlanta 2026
Join us at FabCon Atlanta, March 16-20, for the ultimate Fabric, Power BI, AI and SQL community-led event. Save $200 with code FABCOMM.


| User | Count |
|---|---|
| 98 | |
| 72 | |
| 50 | |
| 49 | |
| 44 |


