Forum Discussion

Create total pass/fail measure for visual
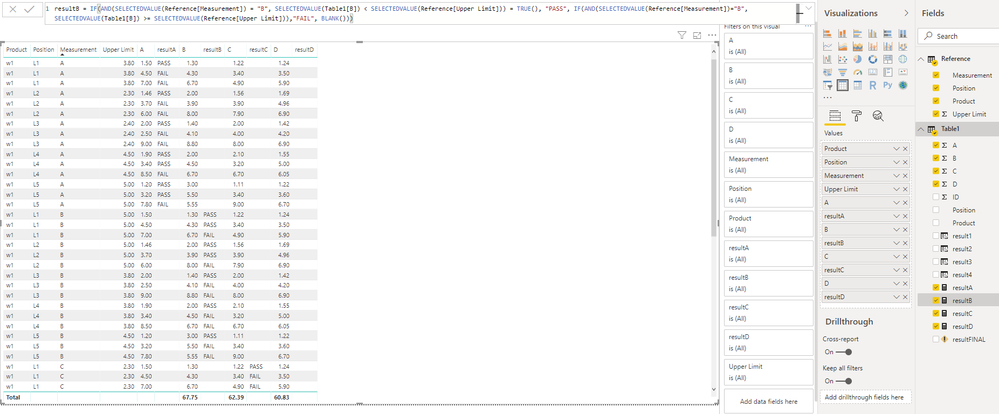
Below is a measure I tried making, but I'm not sure where/how to put it in the visual.

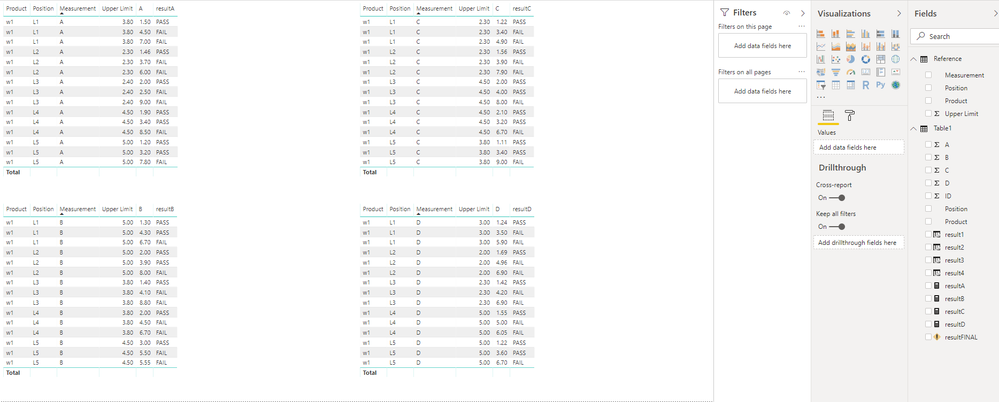
The reason I have 2 different ways of doing it is because when I add more data, the method in the first picture below takes too much memor to display. Therefore, I prefer to find a way to show this resultFINAL column using the style of the second picture.
2 Replies
 v-piga-msft
Resident Rockstar
Hi Anonymous ,
If I understand your requirement correctly that you want to know how to show the resultFINAL measure in the visual.
Actually, I think that should be based on what data you want to see.
In addition, from my point, you could show the resultFINAL measure as the first image and you could not put the resultA, resultB, resultC, and resultD in the table visual so that I think the performance will be better.
If you still need help, feel free to ask.
Best Regards,
Cherry
- AnonymousNot applicable
Hello, v-piga-msft ,
I tried what you mentioned and it's giving me all fails. Clearly it shouldn't be, because all of the values are less than my Upper Limit. See below
I would like to know why it is still incorrect.
thank you