Join us at the 2025 Microsoft Fabric Community Conference
March 31 - April 2, 2025, in Las Vegas, Nevada. Use code MSCUST for a $150 discount! Early bird discount ends December 31.
Register Now- Power BI forums
- Get Help with Power BI
- Desktop
- Service
- Report Server
- Power Query
- Mobile Apps
- Developer
- DAX Commands and Tips
- Custom Visuals Development Discussion
- Health and Life Sciences
- Power BI Spanish forums
- Translated Spanish Desktop
- Training and Consulting
- Instructor Led Training
- Dashboard in a Day for Women, by Women
- Galleries
- Community Connections & How-To Videos
- COVID-19 Data Stories Gallery
- Themes Gallery
- Data Stories Gallery
- R Script Showcase
- Webinars and Video Gallery
- Quick Measures Gallery
- 2021 MSBizAppsSummit Gallery
- 2020 MSBizAppsSummit Gallery
- 2019 MSBizAppsSummit Gallery
- Events
- Ideas
- Custom Visuals Ideas
- Issues
- Issues
- Events
- Upcoming Events
Be one of the first to start using Fabric Databases. View on-demand sessions with database experts and the Microsoft product team to learn just how easy it is to get started. Watch now
- Power BI forums
- Forums
- Get Help with Power BI
- Desktop
- Create line chart from Excel uploaded in SharePoin...
- Subscribe to RSS Feed
- Mark Topic as New
- Mark Topic as Read
- Float this Topic for Current User
- Bookmark
- Subscribe
- Printer Friendly Page
- Mark as New
- Bookmark
- Subscribe
- Mute
- Subscribe to RSS Feed
- Permalink
- Report Inappropriate Content
Create line chart from Excel uploaded in SharePoint
Hallo,
I have uploaded an excel file on a SharePoint Document Library.
In the BI Desktop i bring all sheets of that excel file.
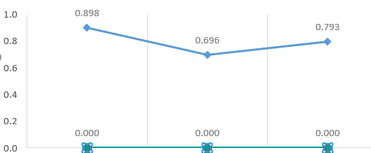
I want to create a Line chart (or KPI) based on rows from 2 different sheets.
Example of tables : Table1 (there are more Rows in every table but i want to create the charts for LW row values)
| Value1 | Value2 | Value3 | |
| LW | 0,898 | 0,696 | 0,793 |
Table 2
| Value1 | Value2 | Value3 | |
| LW | 0,35 | 0,21 | 0,30 |
The chart must look like this:
Any help would be appreciated
- Mark as New
- Bookmark
- Subscribe
- Mute
- Subscribe to RSS Feed
- Permalink
- Report Inappropriate Content
@marial16 , Add the sheet or table name to both the table,
and Merge them
https://radacad.com/append-vs-merge-in-power-bi-and-power-query
and unpivot the columns value 1, value 2 and value
https://radacad.com/pivot-and-unpivot-with-power-bi
Plot the attribute on axis , table name on legend and value on value
At the Microsoft Analytics Community Conference, global leaders and influential voices are stepping up to share their knowledge and help you master the latest in Microsoft Fabric, Copilot, and Purview. ✨
️ November 12th-14th, 2024
Online Event
Register Here
Helpful resources

Join us at the Microsoft Fabric Community Conference
March 31 - April 2, 2025, in Las Vegas, Nevada. Use code MSCUST for a $150 discount!

Microsoft Fabric Community Conference 2025
Arun Ulag shares exciting details about the Microsoft Fabric Conference 2025, which will be held in Las Vegas, NV.

| User | Count |
|---|---|
| 126 | |
| 85 | |
| 69 | |
| 53 | |
| 44 |
| User | Count |
|---|---|
| 202 | |
| 106 | |
| 100 | |
| 64 | |
| 56 |

