Forum Discussion

Create KPI based on YTD and LYTD values
Hi all
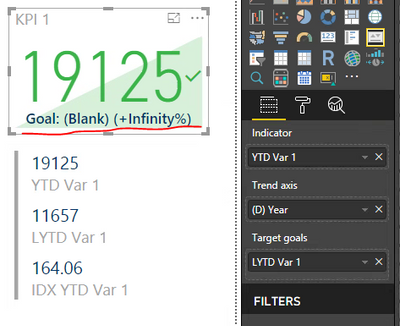
I try to create a KPI based on YTD and LYTD values but get an "Goal: (Blank) (+Infinity%)" instead of +64.06 (look at screenshot). I don't understand why. Isn't it possible to do so based on ytd-values?
YTD works as my indicator-value and LYTD as my "target goal". I use Year as trend axis.
Underlying values are:
YTD = 19125
LYTD = 11657
IDX = 164.06
In the end: I want to use one visual showing the current YTD value and the index of YTD vs LYTD. I don't want to create two card-visuals showing in the 1st the YTD value and in the 2nd the index value.
Is there any possibility to get what I want?
Thanks to everyone for any help.
Simon
5 Replies
- Ashish_Mathur
Super User
Hi,
Share the link from where i can download your PBI file.
- AnonymousNot applicable
Hi Ashish
thank you very much for offering help.
I know found why it did not work me: I simply forgot to add a date-filter!
It seems that it is not enough just to use ytd and lytd variables in an KPI-visualization. One still has to add a date filter otherwise it will not calculate the index. I assumed it is not necessary when using ytd-variable as it is already defined by date-range... so wasn't obvious for me.
Anyway, thank you very much for taking time on this.
Kind regards,
Simon
 ROCKYDO12
Helper III
Hey can you please explain further? I'm running into the same issue on my end. What do you mean by adding a date filter?
 v-chuncz-msft
Community Support
Anonymous,
Based on my experience, you may take a look at https://www.sqlbi.com/articles/filter-arguments-in-calculate/.
- AnonymousNot applicable
Hi Sam
thank you very much for offering help. Pls find in Blog my reply to Ashish on this issue.
Thank you very much.
Kind regards,
Simon
