FabCon is coming to Atlanta
Join us at FabCon Atlanta from March 16 - 20, 2026, for the ultimate Fabric, Power BI, AI and SQL community-led event. Save $200 with code FABCOMM.
Register now!- Power BI forums
- Get Help with Power BI
- Desktop
- Service
- Report Server
- Power Query
- Mobile Apps
- Developer
- DAX Commands and Tips
- Custom Visuals Development Discussion
- Health and Life Sciences
- Power BI Spanish forums
- Translated Spanish Desktop
- Training and Consulting
- Instructor Led Training
- Dashboard in a Day for Women, by Women
- Galleries
- Data Stories Gallery
- Themes Gallery
- Contests Gallery
- QuickViz Gallery
- Quick Measures Gallery
- Visual Calculations Gallery
- Notebook Gallery
- Translytical Task Flow Gallery
- TMDL Gallery
- R Script Showcase
- Webinars and Video Gallery
- Ideas
- Custom Visuals Ideas (read-only)
- Issues
- Issues
- Events
- Upcoming Events
The Power BI Data Visualization World Championships is back! Get ahead of the game and start preparing now! Learn more
- Power BI forums
- Forums
- Get Help with Power BI
- Desktop
- Re: Count of Backlog data
- Subscribe to RSS Feed
- Mark Topic as New
- Mark Topic as Read
- Float this Topic for Current User
- Bookmark
- Subscribe
- Printer Friendly Page


- Mark as New
- Bookmark
- Subscribe
- Mute
- Subscribe to RSS Feed
- Permalink
- Report Inappropriate Content
Count of Backlog data
Hi Team,
I have a table in which we have 4 columns named Ticket Number,Opened Date, Closed Date, State.
Ticket Number: Unique and may have different states based open Open and close.
Opened Date: Contains all dates of past 2 years to till date.
Closed Date: Contains all Dates from past 2 years to till date.
Stae: Open and Closed
Ticket Number Open Date Closed Date State
001 1/4/2022 Open
002 3/4/2022 Open
002 5/4/2022 Closed
001 5/4/2022 Closed
Question is i need backlog count and calculation is in this way: (Opened Ticket Count of current Month)-(Closed Ticket of Current Month)+ (Opened tickets of Previous months which are not closed in any months and is still open)
PLease help me with the solution


- Mark as New
- Bookmark
- Subscribe
- Mute
- Subscribe to RSS Feed
- Permalink
- Report Inappropriate Content
hey @ghouse_peer I just solved something very similar to that in a differnet question.
https://community.powerbi.com/t5/Desktop/End-of-month-backlog/m-p/2469889#M880720
- Mark as New
- Bookmark
- Subscribe
- Mute
- Subscribe to RSS Feed
- Permalink
- Report Inappropriate Content
Hi @SpartaBI
Thanks for the input
Tried your calculation/DAX, i am getting solution, but the count is wrong and difference of current Month(Open-closed)+ diff of previous month = Backlog count. This count i am unable to get it. Kindly help
For ex: lets say earlier to March month Backlog was 100 after all calculations.
Now
March: Open =250; Closed=180; Diff=(250-180)=70; Backlog 70+100=170
April: Open=410; Closed=315; Diff=(410-315)=95; Backlog 95+170=265
This Backlog count i need, PLease help
- Mark as New
- Bookmark
- Subscribe
- Mute
- Subscribe to RSS Feed
- Permalink
- Report Inappropriate Content
hey @ghouse_peer, try this (I still missing some info about how you want to actually present the result, but I hope you this would cover it, I gave you two variations of the first VAR depending on what - I guess - are your options):
Backlog =

--choose one version of the next VAR:
-- in case you have a matrix with months as the filetr contest:
VAR _current_eom =
    EOMONTH( 'Table'[Date] ),0)
-----------------------------
-- in case you have a card to just show the current month based on TODAY() function with no other date related filter context:
VAR _current_eom =
    EOMONTH(TODAY(),0)
-------------------------------

VAR _all =
    CALCULATE (
        DISTINCTCOUNT ( 'Table'[Ticket Number] ),
        'Table'[Open Date] <= _current_eom,
        REMOVEFILTERS('Table')
    )
VAR _resolved =
    CALCULATE (
        DISTINCTCOUNT ( 'Table'[Ticket Number]] ),
       	'Table'[Closed Date] <= _current_eom && 'Table'[Closed Date] > 0,
        REMOVEFILTERS('Table')
    )
RETURN
_all - _resolved- Mark as New
- Bookmark
- Subscribe
- Mute
- Subscribe to RSS Feed
- Permalink
- Report Inappropriate Content
HI @SpartaBI
Thanks for the solution.
our expected output is :
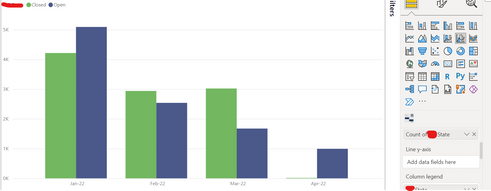
This line and clustered column chart represents count of state(open,Closed) w.r.t months. I need to get line graph(line Yaxis)of backlog.
I have 2 tables for this.
Table name: Data
| Ticket Number | Opened Date | Closed Date | State |
Table Name: Calender
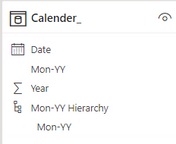
Relationship: 1 to Many [Date to Opened date: Unidirectional Active]
1 to Many[ Date to Closed Date: Unidirectional Inactive]
1 to many [ Date to State : Unidirectional Inactive]
Calculation for Backlog [Line Y axis]: count of (Open-Closed+Previous Backlog) i,ePrevious backlog in the sense open-Closed of previous month and so on.
Let us Assume Dec month Backlog was 250. in Jan 22 we got Open:300 Closed 210 so backlog will be (300-210)+250=340. This should be shown in line Yaxis in chart for Jan month.
I tried your measure and i was unable to create firs VAR out of two u have provided. It is not taking any of the fields from either of the table and was expecting a measure out of table to create VAR.
Kindly help with any other alternative to get the solution.
- Mark as New
- Bookmark
- Subscribe
- Mute
- Subscribe to RSS Feed
- Permalink
- Report Inappropriate Content
Hi Sparta,
Tried your calculation/DAX, i am getting solution, but the count is wrong and difference of current Month(Open-closed)+ diff of previous month = Backlog count. This count i am unable to get it. Kindly help
For ex: lets say earlier to March month Backlog was 100 after all calculations.
Now
March: Open =250; Closed=180; Diff=(250-180)=70; Backlog 70+100=170
April: Open=410; Closed=315; Diff=(410-315)=95; Backlog 95+170=265
This Backlog count i need, PLease help


- Mark as New
- Bookmark
- Subscribe
- Mute
- Subscribe to RSS Feed
- Permalink
- Report Inappropriate Content
- Mark as New
- Bookmark
- Subscribe
- Mute
- Subscribe to RSS Feed
- Permalink
- Report Inappropriate Content
Hi @amitchandak
Thanks for the solution
I tried your measure which you showed in your file. It returns only difference and count is high in case of my data.
Please check this Detailed version of my question and scenario this would help you to generate solution.
our expected output is :
This line and clustered column chart represents count of state(open,Closed) w.r.t months. I need to get line graph(line Yaxis)of backlog.
I have 2 tables for this.
Table name: Data
| Ticket Number | Opened Date | Closed Date | State |
Table Name: Calender
Relationship: 1 to Many [Date to Opened date: Unidirectional Active]
1 to Many[ Date to Closed Date: Unidirectional Inactive]
1 to many [ Date to State : Unidirectional Inactive]
Calculation for Backlog [Line Y axis]: count of (Open-Closed+Previous Backlog) i,ePrevious backlog in the sense open-Closed of previous month and so on.
Let us Assume Dec month Backlog was 250. in Jan 22 we got Open:300 Closed 210 so backlog will be (300-210)+250=340. This should be shown in line Yaxis in chart for Jan month.
Kindly help with any other alternative to get the solution.
- Mark as New
- Bookmark
- Subscribe
- Mute
- Subscribe to RSS Feed
- Permalink
- Report Inappropriate Content
- Mark as New
- Bookmark
- Subscribe
- Mute
- Subscribe to RSS Feed
- Permalink
- Report Inappropriate Content
Hi @amitchandak
Thanks for the input and files
Tried your calculation/DAX and referred to the files and tried, i am getting solution, but the count is wrong and difference of current Month(Open-closed)+ diff of previous month = Backlog count. This count i am unable to get it. Kindly help
For ex: lets say earlier to March month Backlog was 100 after all calculations.
Now
March: Open =250; Closed=180; Diff=(250-180)=70; Backlog 70+100=170
April: Open=410; Closed=315; Diff=(410-315)=95; Backlog 95+170=265
This Backlog count i need, PLease help
- Mark as New
- Bookmark
- Subscribe
- Mute
- Subscribe to RSS Feed
- Permalink
- Report Inappropriate Content
Hi Amit Chandak,
Thanks for the files for reference.
Tried your calculation/DAX, i am getting solution, but the count is wrong and difference of current Month(Open-closed)+ diff of previous month = Backlog count. This count i am unable to get it. Kindly help
For ex: lets say earlier to March month Backlog was 100 after all calculations.
Now
March: Open =250; Closed=180; Diff=(250-180)=70; Backlog 70+100=170
April: Open=410; Closed=315; Diff=(410-315)=95; Backlog 95+170=265
This Backlog count i need, PLease help

Helpful resources

Power BI Dataviz World Championships
The Power BI Data Visualization World Championships is back! Get ahead of the game and start preparing now!

Power BI Monthly Update - December 2025
Check out the December 2025 Power BI Holiday Recap!

FabCon Atlanta 2026
Join us at FabCon Atlanta, March 16-20, for the ultimate Fabric, Power BI, AI and SQL community-led event. Save $200 with code FABCOMM.

| User | Count |
|---|---|
| 39 | |
| 37 | |
| 33 | |
| 32 | |
| 29 |


| User | Count |
|---|---|
| 133 | |
| 88 | |
| 85 | |
| 68 | |
| 64 |


