- Power BI forums
- Updates
- News & Announcements
- Get Help with Power BI
- Desktop
- Service
- Report Server
- Power Query
- Mobile Apps
- Developer
- DAX Commands and Tips
- Custom Visuals Development Discussion
- Health and Life Sciences
- Power BI Spanish forums
- Translated Spanish Desktop
- Power Platform Integration - Better Together!
- Power Platform Integrations (Read-only)
- Power Platform and Dynamics 365 Integrations (Read-only)
- Training and Consulting
- Instructor Led Training
- Dashboard in a Day for Women, by Women
- Galleries
- Community Connections & How-To Videos
- COVID-19 Data Stories Gallery
- Themes Gallery
- Data Stories Gallery
- R Script Showcase
- Webinars and Video Gallery
- Quick Measures Gallery
- 2021 MSBizAppsSummit Gallery
- 2020 MSBizAppsSummit Gallery
- 2019 MSBizAppsSummit Gallery
- Events
- Ideas
- Custom Visuals Ideas
- Issues
- Issues
- Events
- Upcoming Events
- Community Blog
- Power BI Community Blog
- Custom Visuals Community Blog
- Community Support
- Community Accounts & Registration
- Using the Community
- Community Feedback
Earn a 50% discount on the DP-600 certification exam by completing the Fabric 30 Days to Learn It challenge.
- Power BI forums
- Forums
- Get Help with Power BI
- Desktop
- Count all months belonging to 1 autocalendat perio...
- Subscribe to RSS Feed
- Mark Topic as New
- Mark Topic as Read
- Float this Topic for Current User
- Bookmark
- Subscribe
- Printer Friendly Page
- Mark as New
- Bookmark
- Subscribe
- Mute
- Subscribe to RSS Feed
- Permalink
- Report Inappropriate Content
Count all months belonging to 1 autocalendat period
Let me first share the situation :
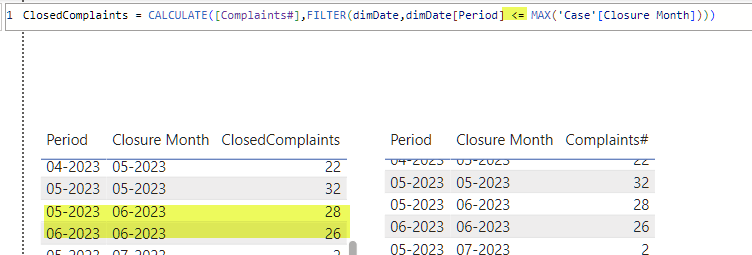
I am trying to set up a measure that for instance for period 06-2023 give me all complaints that belong to closure month equal to the Period, so 06-2023.
As you see what I now have only gives me the 26 and does not also add the 28 making it 54 which is correct.
Tried <= in the filter but that also does not work as that gives me the extra line but does not add it to the period I want:
Well it is correct as the period for these 28 complaints where month 05 but they got closed in period 06 and I am looking for all that was closed in period 06.
No using Closure month instead of period will not be an option because I want this overall period because next to Close complaints I also want to put in New complaints and Open complaints.
All based on this general period from the autocalendar.
How would you guys set it up so for period 06 it will count all that belongs to closure month 06?
- Mark as New
- Bookmark
- Subscribe
- Mute
- Subscribe to RSS Feed
- Permalink
- Report Inappropriate Content
Hi @rpinxt ,
Please try:
ClosedComplaints 2 =
CALCULATE (
    [Complaints#],
    'Table'[month close] = MAX ( 'Table'[month close] ),
    ALLEXCEPT ( 'Table', 'Table'[month close] )
)
About how to share files (Files should not contain private information.):
How to provide sample data in the Power BI Forum
Best Regards,
Gao
Community Support Team
If there is any post helps, then please consider Accept it as the solution to help the other members find it more quickly.
If I misunderstand your needs or you still have problems on it, please feel free to let us know. Thanks a lot!
How to get your questions answered quickly -- How to provide sample data in the Power BI Forum
- Mark as New
- Bookmark
- Subscribe
- Mute
- Subscribe to RSS Feed
- Permalink
- Report Inappropriate Content
Thanks @v-cgao-msft for this.
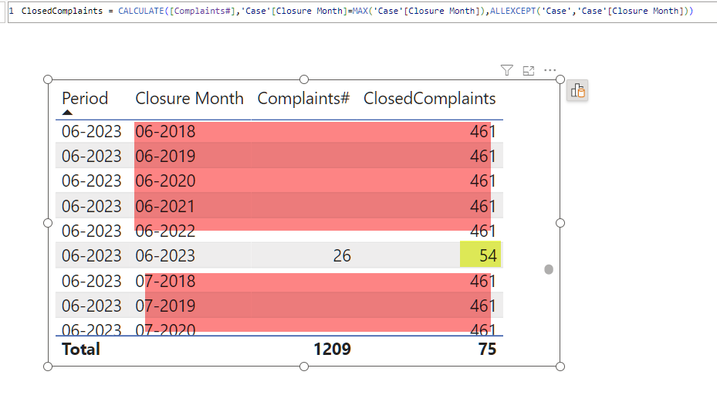
But for my situation this is doing strange things:
So the 54 is correct but al the rest coming is not.
Guessing it was because of field closure month and complaints in so I took these out:
Not sure what it does now but the numbers are wrong.
That was what I am trying to explain.
The field Period comes from an autocalendare (that one is leading!)
It is connected to 'Case' table on the field 'Createdate' (so not closure month!!)
What I want is the view for period bringing in what was New (initiation month) and Closed (Closure month).
Both field that are in the 'Case' table.
So based on the Period field from the autocalendar it should sum the complaints for the Initiantion Month and the Closure month (as separate columns) of the 'Case' table.
I know I cannot add the sample here because I am not superuser or employee.
So I already had made a link to google drive and sent it to the helper in privat message.
But I can past the link here :
https://drive.google.com/file/d/1-N6ee0K-KxnxUlARAf2LqMOSLIbb4zXg/view?usp=sharing
- Mark as New
- Bookmark
- Subscribe
- Mute
- Subscribe to RSS Feed
- Permalink
- Report Inappropriate Content
Hi @rpinxt ,
Please try:
ClosedComplaints =
CALCULATE (
    [Complaints#],
    'Case'[Closure Month] = MAX ( 'Case'[Closure Month] ),
    ALLSELECTED(),VALUES('Case'[Closure Month])
)
Best Regards,
Gao
Community Support Team
If there is any post helps, then please consider Accept it as the solution to help the other members find it more quickly.
If I misunderstand your needs or you still have problems on it, please feel free to let us know. Thanks a lot!
How to get your questions answered quickly -- How to provide sample data in the Power BI Forum
- Mark as New
- Bookmark
- Subscribe
- Mute
- Subscribe to RSS Feed
- Permalink
- Report Inappropriate Content
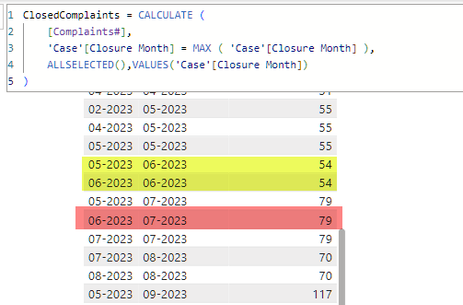
Thanks @v-cgao-msft at first glace looks ok :
It gives 54, but I only want the line of period 06-2023 so the bottom of the 2 lines with 54.
Therefore I take out closure month:
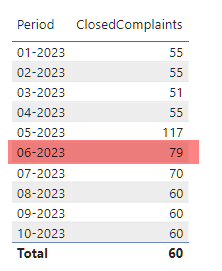
And there is the 79 again! But from the picture above you can see what is happening.
It is part of closure month 07-2023!
Apparently complaints of 3 months (periods) have been closed in closure month 07-2023.
I need field period 06-2023 report the complaints that are part of closure month 06-2023.
- Mark as New
- Bookmark
- Subscribe
- Mute
- Subscribe to RSS Feed
- Permalink
- Report Inappropriate Content
@Ahmedx ok I tried recreating m1 with my data, but on the userelationship I get this error:
But I think the fields are correct.
Or do I need to make a separate DimDate table like you have made with a summarize on the 2 fields.
But you use priod from the table but period comes from my original dimDate table.
And Closure Month comes from my 'Case' table.
- Mark as New
- Bookmark
- Subscribe
- Mute
- Subscribe to RSS Feed
- Permalink
- Report Inappropriate Content
@Ahmedx ok I cannot upload an excel file. If you can show me how to do that please let me know.
But maybe with this picture:
So columns F till J are actual column in my table 'Case'.
The Complaint numbers I just randomly chose so they are not the same as above but the method would be the same.
In column A I have the period which is coming from an autocalendar.
Column B and C are then measures to setup.
You see for closed complaints of Period 06-2023 it takes 15 and 8 but also 20 from create date 20-05-23 because the closure month for that line is 06-2023, so equal to the period of the autocalendar.
Hope this makes it more clear. Maybe also this helps:
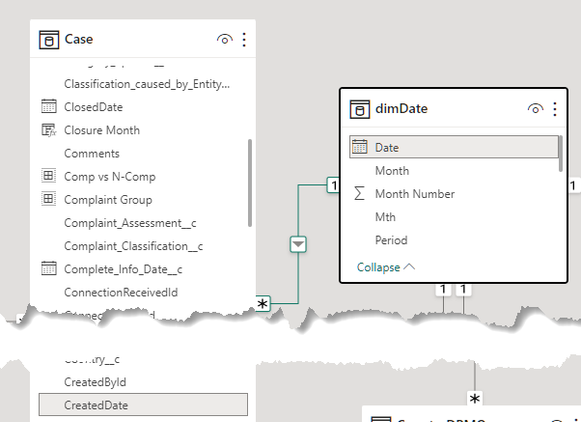
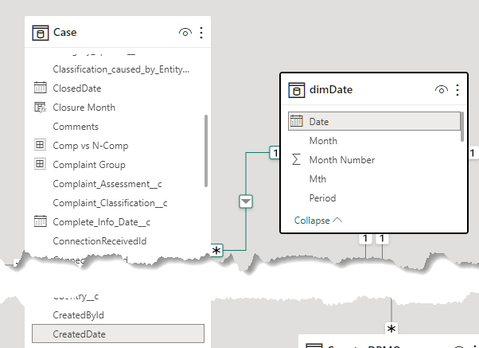
In my model dimDate is connected to CreateDate of table 'Case'.
ClosedDate and calculated column Closure Month are also in but I cannot link the dimDate to CreateDate AND ClosedDate as far as I am aware.
- Mark as New
- Bookmark
- Subscribe
- Mute
- Subscribe to RSS Feed
- Permalink
- Report Inappropriate Content
- Mark as New
- Bookmark
- Subscribe
- Mute
- Subscribe to RSS Feed
- Permalink
- Report Inappropriate Content
Thanks @Ahmedx , this looks to be doing it in your example.
But what is this all doing?? 😧
So there is no direct formula in which you can do it as the sumif in my excel example?
Sum the complaints where Closure Month of the table equals Period of the dimDate tabel?
I will try to implement this solution in my report and let you know if it works in my case.
- Mark as New
- Bookmark
- Subscribe
- Mute
- Subscribe to RSS Feed
- Permalink
- Report Inappropriate Content
you need to create those connections.
- Mark as New
- Bookmark
- Subscribe
- Mute
- Subscribe to RSS Feed
- Permalink
- Report Inappropriate Content
I tried but not working.
Situation is different also.
You have period and closure month in the same table!
But in reality it is not.
Period is in the Autocalendar table and Closure Month is in the 'Case' table.
See picture :
Setting it up like you have still gives the same error.
- Mark as New
- Bookmark
- Subscribe
- Mute
- Subscribe to RSS Feed
- Permalink
- Report Inappropriate Content
pls try this
USERELATIONSHIP('Table'[month close],dimDate2[priod])
,CROSSFILTER('Table'[priod],dimDate2[priod],None))
------
'Table'[month close]<===== dimDate2[priod])
create such a connection

- Mark as New
- Bookmark
- Subscribe
- Mute
- Subscribe to RSS Feed
- Permalink
- Report Inappropriate Content
Thanks @Ahmedx but this already goes wrong a step earlier I think.
You made dimDate2 with a summarize like this :
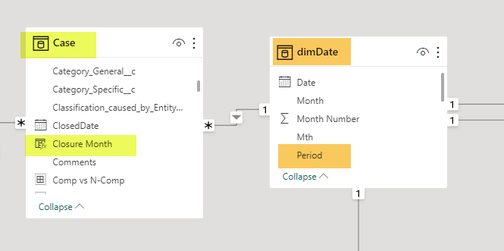
the formula :
dimDate2 = SUMMARIZE('Table','Table'[priod],'Table'[month close])
will not work because summarize can only hold 1 table.
- Mark as New
- Bookmark
- Subscribe
- Mute
- Subscribe to RSS Feed
- Permalink
- Report Inappropriate Content
Share sample pbix file to help you.
- Mark as New
- Bookmark
- Subscribe
- Mute
- Subscribe to RSS Feed
- Permalink
- Report Inappropriate Content
I sent you a privat message with a google drive link.
- Mark as New
- Bookmark
- Subscribe
- Mute
- Subscribe to RSS Feed
- Permalink
- Report Inappropriate Content
How would I do that? I cannot add files to my posts here.....
- Mark as New
- Bookmark
- Subscribe
- Mute
- Subscribe to RSS Feed
- Permalink
- Report Inappropriate Content
- Mark as New
- Bookmark
- Subscribe
- Mute
- Subscribe to RSS Feed
- Permalink
- Report Inappropriate Content
- Mark as New
- Bookmark
- Subscribe
- Mute
- Subscribe to RSS Feed
- Permalink
- Report Inappropriate Content
- Mark as New
- Bookmark
- Subscribe
- Mute
- Subscribe to RSS Feed
- Permalink
- Report Inappropriate Content
Thanks @Ahmedx but how would this be a suitable model you sent?
You have this:
That is exactly the same that I have is it not?
What I am after is 1 line for period 06 where as a result for ClosedComplaints it will return 54.
Not 2 lines.
Also do not understand why in your model you have 2 dimDate tables.
- Mark as New
- Bookmark
- Subscribe
- Mute
- Subscribe to RSS Feed
- Permalink
- Report Inappropriate Content
I probably didn't understand what you want
show the result in Excel
Helpful resources

Microsoft Fabric Learn Together
Covering the world! 9:00-10:30 AM Sydney, 4:00-5:30 PM CET (Paris/Berlin), 7:00-8:30 PM Mexico City

Power BI Monthly Update - April 2024
Check out the April 2024 Power BI update to learn about new features.

| User | Count |
|---|---|
| 103 | |
| 101 | |
| 81 | |
| 78 | |
| 66 |
| User | Count |
|---|---|
| 122 | |
| 110 | |
| 94 | |
| 82 | |
| 77 |

