Forum Discussion

Converting Excel Formulas to DAX
Hi there, I am trying to convert an Excel document into my data model and am having trouble with absolute referencing. Here is a screenshot of the data:
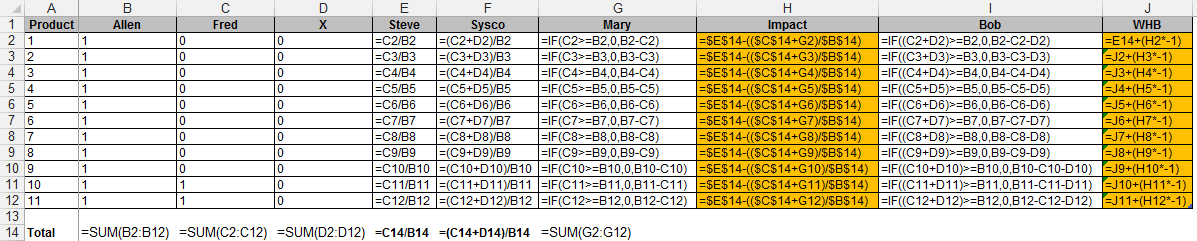
Columns H and J are the I am having trouble with. For Column H, how do I reference the totals of columns E,C, and B while getting the rows for row G? I assumed it would be the sum function of that column "Sum(Impact)" but the end result is incorrect. I have tried using the Earlier function but need some direction to solving this problem. The calculated field/measure gives me incorrect numbers when it does work. I also need additional help with Column J which I have yet to pursue as hard since it uses Column H.
Notes:
- All fields are numerical
- Data has been hidden for privacy reasons
- I have created the working formulas as calculated columns but did briefly experiment with calculated columns, however the datasheet will be long so I do not want the column to calculate for all rows but if it will fix the formula, I will work with that as well.
Any help would be appreciated in leading me in the right direction, thanks in advance.
Didn't have time to read the whole thread, but your WHB is impossible in DAX as you've got it defined. Luckily we can redefine it in a much more reasonable way (in terms of fields being accessed). Here are all the measures in clean DAX for you. It should be a good exercise in observing row vs filter context.
DAX isn't really the tool of choice for this, though. This sort of data munging should be done before the model is loaded. Unless you want these as measures, in which case, most of the ALL()s should be replaced with ALLSELECTED(), and the raw column references will have to be wrapped in SUM()s.
Steve =
DIVIDE( SomeDamnTable[Fred], SomeDamnTable[Allen] ) // All row context

Sysco =
DIVIDE(
	SomeDamnTable[Fred] + SomeDamnTable[X] // All row context
	,SomeDamnTable[Allen]
)

Mary =
IF(
	SomeDamnTable[Fred] >= SomeDamnTable[Allen] // All row context
	,0
	,SomeDamnTable[Allen] - SomeDamnTable[Fred]
)

Impact =
CALCULATE( // Do this whole thing in a filter context made up of the entire table
	DIVIDE(
		SUM( SomeDamnTable[Fred] )
		,SUM( SomeDamnTable[Allen] )
	)
	,ALL( SomeDamnTable )
) - DIVIDE(
		CALCULATE( // this CALCULATE is in a filter context of the entire table
			SUM( SomeDamnTable[Fred] )
			,ALL( SomeDamnTable )
		) + SomeDamnTable[Mary] // This is row context
		,CALCULATE( // this calculate is in the filter context of the whole table
			SUM( SomeDamnTable[Allen] )
			,ALL( SomeDamnTable )
		)
	)


Bob =
IF( // all row context
	( SomeDamnTable[Fred] + SomeDamnTable[X] ) >= SomeDamnTable[Allen]
	,0
	,SomeDamnTable[Allen] - SomeDamnTable[Fred] - SomeDamnTable[X]
)

WHB =
CALCULATE(
        DIVIDE(
                SUM( SomeDamnTable[Fred] )
                ,SUM( SomeDamnTable[Allen] )
        )
        ,ALL( SomeDamnTable )
) - CALCULATE(
        SUM( SomeDamnTable[Impact] )
        ,FILTER(
                ALL( SomeDamnTable )
                ,SomeDamnTable[Index] <= EARLIER( SomeDamnTable[Index] )
        )
 )
You should try to do this sort of thing before your data hits your model. Here's some Power Query to get you there. You can examine all this in the .pbix here.
let
    Source = Table.FromRows(Json.Document(Binary.Decompress(Binary.FromText("i45WMlTSAWMDMI7ViVYywhAxxhAxwRAxxRAxwxAxxxCxwBCxxBAxNIAKGSKEDFGFYgE=", BinaryEncoding.Base64), Compression.Deflate)), let _t = ((type text) meta [Serialized.Text = true]) in type table [Product = _t, Allen = _t, Fred = _t, X = _t]),
    #"Changed Type" = Table.TransformColumnTypes(Source,{{"Product", Int64.Type}, {"Allen", Int64.Type}, {"Fred", Int64.Type}, {"X", Int64.Type}}),
    Steve = Table.AddColumn(#"Changed Type", "Steve", each [Fred] / [Allen]),
    Sysco = Table.AddColumn(Steve, "Sysco", each ( [Fred] + [X] ) / [Allen]),
    Mary = Table.AddColumn(Sysco, "Mary", each if [Fred] >= [Allen]
then 0
else [Allen] - [Fred]),
    Impact = Table.AddColumn(Mary, "Impact", each ( List.Sum( Mary[Fred] ) / List.Sum( Mary[Allen] ) )
- ( ( List.Sum( Mary[Fred] ) + [Mary] )
  / List.Sum( Mary[Allen] ) )),
    Bob = Table.AddColumn(Impact, "Bob", each if ( [Fred] + [X] ) >= [Allen]
then 0
else [Allen] - [Fred] - [X]),
    Index = Table.AddIndexColumn(Bob, "Index", 1, 1),
    WHB = Table.AddColumn(Index, "WHB", each let
  CurrentRow = [Index]
  ,Base =
    ( List.Sum( Index[Fred] )
      / List.Sum( Index[Allen] ) )
  ,SumImpact =
    List.Sum(
      Table.Column(
        Table.SelectRows( Index
          , each [Index] <= CurrentRow )
        ,"Impact" ) )
  ,WHB = Base - SumImpact
in
  WHB),
    #"Removed Columns" = Table.RemoveColumns(WHB,{"Index"}),
    #"Changed Type1" = Table.TransformColumnTypes(#"Removed Columns",{{"Impact", Currency.Type}, {"WHB", type number}, {"Mary", Int64.Type}, {"Sysco", Int64.Type}, {"Steve", Int64.Type}, {"X", Int64.Type}, {"Fred", Int64.Type}, {"Allen", Int64.Type}, {"Product", Int64.Type}, {"Bob", Int64.Type}})
in
    #"Changed Type1"

32 Replies
- Greg_DecklerCommunity Champion
Make sure that you use SUMX with an ALL filter for your measures (the equivalents of your row 14) I expect that what you are seeing is that when you put the measures in a table or use them in a column, that they are being context filtered by the row they are in and that is messing up your result. Just spit-balling since I can't see what you are seeing and do not have any sanitized sample data with the correct results desired to go off of.
 GTRHelper III
Unpivoting the data is not a long-term option at the moment.
smoupre, I tried your logic and get error (second argument contains a string error) on the ALL function. Here is what I have:
=SUM([STEVE]) - (([SumFred] + SUMX(TABLENAME,[MARY])) / [SumAllen])
SumFred and SumAllen are just separate measures that give me the sums for the two columns, althought the sum(Fred) would also work, just using it for testing at the moment.
The result I get for this measure is "-100.00%" for all rows which is obviously incorrect. I should be getting "-9.09%"
Thanks
- kcantorCommunity Champion
I would recommend creating seperate measures and then using the divide function instead of trying to reference so many columns in the same measure. Build each measure then divide one measure by the other.
=DIVIDE([totalFredMary],[Allen]) of course you should use actual measure names, I just threw those together.
 itchyeyeballsImpactful IndividualI'd unpivot the data so all the consistent raw values are in a single column and then use measures with the calculate function to create the various totals as required.
I'd then consider creating separate tables to hold aggregate/ calculated data and link in the model

