Forum Discussion
Conditional formatting one column based on a value in a matrix visual with multiple columns
- Anonymous3 years ago
Hi neskowin ,
According to your description, here are my steps you can follow as a solution.
(1)My test data is the same as yours.
(2) We can create two measures.
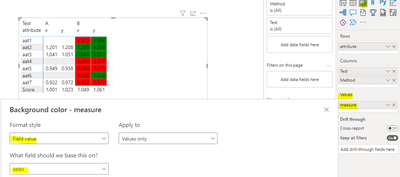
measure = SUM('Table'[value])color = var a=MAXX(FILTER(ALLSELECTED('Table'),[Test]="A"&&[attribute]="Score"&&[Method]="x"),[value]) var b=MAXX(FILTER(ALLSELECTED('Table'),[Test]="A"&&[attribute]="Score"&&[Method]="y"),[value]) return IF(OR(SELECTEDVALUE('Table'[Test])="A",SELECTEDVALUE('Table'[attribute])="Score"),"White",(IF(or(SELECTEDVALUE('Table'[Test])="B"&&SELECTEDVALUE('Table'[Method])="x"&&SUM('Table'[value])>a,SELECTEDVALUE('Table'[Test])="B"&&SELECTEDVALUE('Table'[Method])="y"&&SUM('Table'[value])>b),"green","red")))(3)Set the conditional formatting as shown in the following figure and then the result is as follows.
Best Regards,
Neeko Tang
If this post helps, then please consider Accept it as the solution to help the other members find it more quickly.
Hi neskowin ,
According to your description, here are my steps you can follow as a solution.
(1)My test data is the same as yours.
(2) We can create two measures.
measure = SUM('Table'[value])color = var a=MAXX(FILTER(ALLSELECTED('Table'),[Test]="A"&&[attribute]="Score"&&[Method]="x"),[value])
var b=MAXX(FILTER(ALLSELECTED('Table'),[Test]="A"&&[attribute]="Score"&&[Method]="y"),[value])
return IF(OR(SELECTEDVALUE('Table'[Test])="A",SELECTEDVALUE('Table'[attribute])="Score"),"White",(IF(or(SELECTEDVALUE('Table'[Test])="B"&&SELECTEDVALUE('Table'[Method])="x"&&SUM('Table'[value])>a,SELECTEDVALUE('Table'[Test])="B"&&SELECTEDVALUE('Table'[Method])="y"&&SUM('Table'[value])>b),"green","red")))
(3)Set the conditional formatting as shown in the following figure and then the result is as follows.
Best Regards,
Neeko Tang
If this post helps, then please consider Accept it as the solution to help the other members find it more quickly.
- neskowin3 years agoFrequent Visitor
Thanks. A follow-up question. The 'Table' in my project is a matrix visual created with a measure M1. In the matrix visual, the Rows are the attributes, the Columns are Tests and Methods, and the Values is the measure M1. The Score is in another matrix visual, but uses the same fields to compute the Score corresponding to the tests and methods, but using a different measure, M2. With your solution, do I now create a data table ('Table') from the matrix visuals, and if yes, is there a way to do it? If not, is there a way to refer to the matrix visual columns from your 'color' measure? Thank you.