New Offer! Become a Certified Fabric Data Engineer
Check your eligibility for this 50% exam voucher offer and join us for free live learning sessions to get prepared for Exam DP-700.
Get Started- Power BI forums
- Get Help with Power BI
- Desktop
- Service
- Report Server
- Power Query
- Mobile Apps
- Developer
- DAX Commands and Tips
- Custom Visuals Development Discussion
- Health and Life Sciences
- Power BI Spanish forums
- Translated Spanish Desktop
- Training and Consulting
- Instructor Led Training
- Dashboard in a Day for Women, by Women
- Galleries
- Community Connections & How-To Videos
- COVID-19 Data Stories Gallery
- Themes Gallery
- Data Stories Gallery
- R Script Showcase
- Webinars and Video Gallery
- Quick Measures Gallery
- 2021 MSBizAppsSummit Gallery
- 2020 MSBizAppsSummit Gallery
- 2019 MSBizAppsSummit Gallery
- Events
- Ideas
- Custom Visuals Ideas
- Issues
- Issues
- Events
- Upcoming Events
Don't miss out! 2025 Microsoft Fabric Community Conference, March 31 - April 2, Las Vegas, Nevada. Use code MSCUST for a $150 discount. Prices go up February 11th. Register now.
- Power BI forums
- Forums
- Get Help with Power BI
- Desktop
- Comparing Current and Previous Moving Annual Total...
- Subscribe to RSS Feed
- Mark Topic as New
- Mark Topic as Read
- Float this Topic for Current User
- Bookmark
- Subscribe
- Printer Friendly Page
- Mark as New
- Bookmark
- Subscribe
- Mute
- Subscribe to RSS Feed
- Permalink
- Report Inappropriate Content
Comparing Current and Previous Moving Annual Total (MAT)
Hello All,
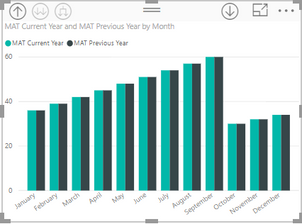
Context: I am trying to compare the Current MAT with Previous MAT by month. The idea being that I would have a bar, or line, graph, showing 'current MAT' as of Aug 2018 compared to 'Previous MAT' as of Aug 2017.
So Far: I've been fiddling with a couple of different MAT formulae.
MAT Current Year =
CALCULATE (
    [Total Value],
    FILTER (
        ALL ( 'Calendar'),
        'Calendar'[Sequential Day Number] > MAX ( 'Calendar'[Sequential Day Number] ) - 365
             && 'Calendar'[Sequential Day Number] <= MAX ( 'Calendar'[Sequential Day Number] )
    )
)
And.
MAT Current Year V2 =
CALCULATE (
    SUMX(
        FILTER( 'table1','table1'[sales]),
        [Total Value]
    ),
    DATESINPERIOD(
        'Calendar'[Date],LASTDATE ( 'Calendar'[Date]),
        -12,
        MONTH
    )
)
These are doing exactly what they are supposed to - calculate the MAT each month.
Problem: So, how do I go about displaying a 'previous MAT' side-by-side with the current? At first I tried the date criteria to be 'a year earlier' like so:
MAT Previous Year =

CALCULATE (
    [Total Value],
    FILTER (
        ALL ( 'Calendar'),
        'Calendar'[Sequential Day Number] > MAX( 'Calendar'[Sequential Day Number] ) - 730
             && 'Calendar'[Sequential Day Number] <= MAX ( 'Calendar'[Sequential Day Number] ) - 365 )
)
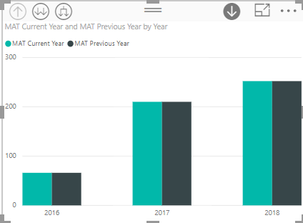
But it does not come out with the desired results:


Is this an issue with formula or an issue with how I am displaying it?
Many thanks in advance!
- Mark as New
- Bookmark
- Subscribe
- Mute
- Subscribe to RSS Feed
- Permalink
- Report Inappropriate Content
Hi @Reigning_data,
You should add [dates] from calendar table into chart X-axis. Besides, please use SAMEPERIODLASTYEAR to calculate MAT in previous year.
Regards,
Yuliana Gu
If this post helps, then please consider Accept it as the solution to help the other members find it more quickly.
Helpful resources

Join us at the Microsoft Fabric Community Conference
March 31 - April 2, 2025, in Las Vegas, Nevada. Use code MSCUST for a $150 discount! Prices go up Feb. 11th.

Power BI Monthly Update - January 2025
Check out the January 2025 Power BI update to learn about new features in Reporting, Modeling, and Data Connectivity.

| User | Count |
|---|---|
| 144 | |
| 87 | |
| 65 | |
| 50 | |
| 45 |
| User | Count |
|---|---|
| 217 | |
| 88 | |
| 81 | |
| 65 | |
| 56 |
