Forum Discussion

shiner1's avatar
shiner1
Frequent Visitor
8 years ago
Solved

Clustered stacked column chart

Hello


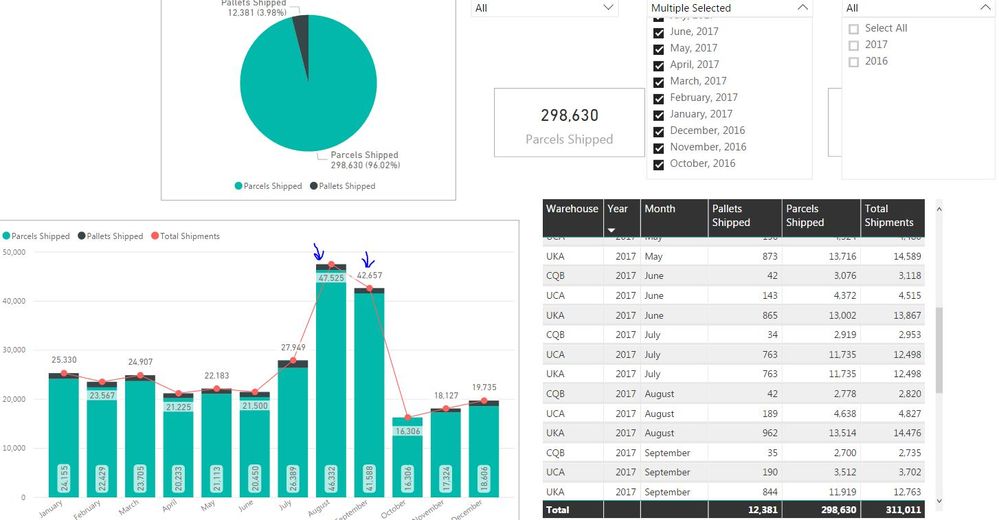
I have a question when adding mulitple years months in a bar chart the previous years month totals to one month. Like say you wanted to look at September 2016- September 2017 actual sales for the month. The month of September will be bigger than all the other months because Power Bi totals 2016+2017. Does anyone know how to fix this?

  • shiner1,


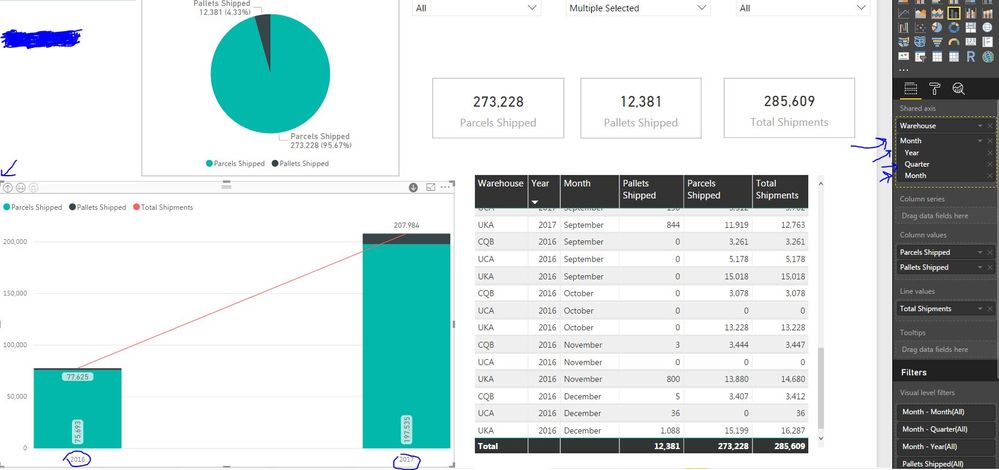
    You need to select the third icon "Expand all down one level in the hierarchy" in the top left corner of the visualization.

3 Replies

  • j567boston's avatar
    j567boston
    Frequent Visitor

    Wouldn't you just make the axis Month - Year instead of just Month so you break it out into 13 columns and not 12?


    -J

  • shiner1's avatar
    shiner1
    Frequent Visitor

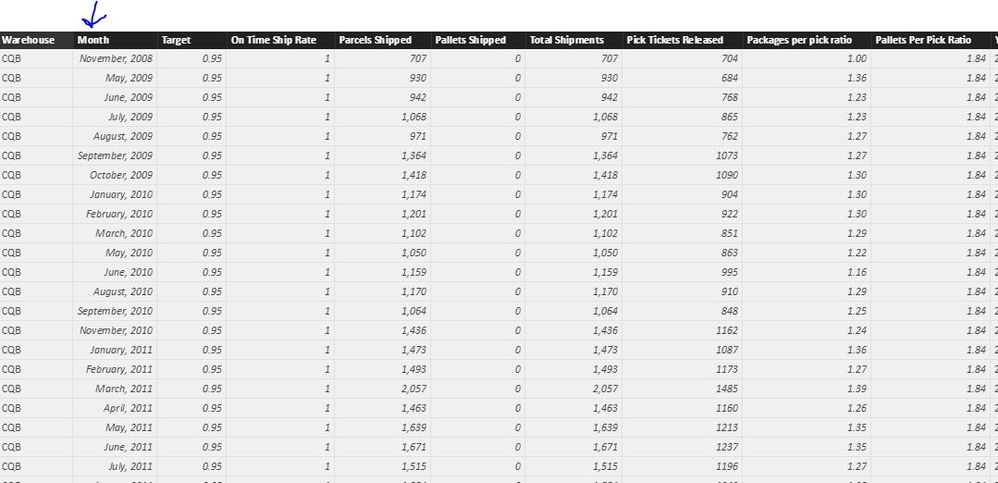
    I have the data in month-year format from 2008 to 2017. I have the drill down turned on to go year, quarter, month. Not sure if power bi is only set to show one year 12 columns?


  • v-chuncz-msft's avatar
    v-chuncz-msft
    Icon for Community Support rankCommunity Support

    shiner1,


    You need to select the third icon "Expand all down one level in the hierarchy" in the top left corner of the visualization.