Forum Discussion
Clustered Stacked Column Chart: Segmented Analysis
- 4 years ago
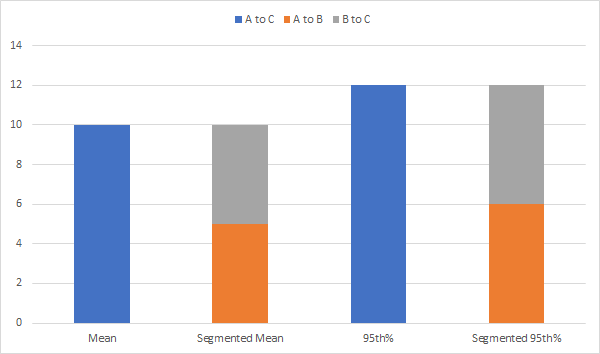
I am happy to report that I solved this. The way I approached it involved much work. Maybe there is a better way. Please share if you find a way.
1. I took my primary query with the calculations (e.g. A to C, A to B, and B to C) and duplicated (or referenced) them about 4 times, naming each of the duplicates as follows: Mean, Mean Segmented, Percentile, Percentile Segmented.
2. For each of the queries, I created a Category Field and named them accordingly (Mean, Mean Segmented, Percentile, Percentile Segmented).
3. For the Mean and Percentile Queries, I ripped out the calculations "A to B" and "B to C". Also, in each query, I relabeled the "A to B" calculation. For example, in the Mean Query, I labeled the column as "A to B Mean" and in the Percentile query, I renamed it as "A to B Percentile.
4. For the queries Mean Segmented and Percentile Segmented, I ripped out the "A to C" calculation column. Then, I renamed the remaining calculation columns, similar to the method I used in Step 3.
5. I duplicated the Mean Query and then renamed it "Combo".
6. I appended the following queries to the Combo Query: Mean Segmented, Percentile, Percentile Segmented.
7. Close and Save.
8. I located the following in the fields pane: "A to C Percentile", "A to B Percentile", and "B to C Percentile". For each of these, I created a measure to calculate the 95th percentile.
9. In the Visualization Pane, I chose stacked column chart.
10. I drug "Category" from the Combo query into the AXIS field.
11. I drug the following fields into the VALUE field and set them to AVERAGES: A to C Mean, A to B Mean, B to C Mean.
12. I drug the following MEASUREMENT fields into the VALUE field: A to C percentile, A to B percentile, and B to C percentile.
I hope this helps!
I am happy to report that I solved this. The way I approached it involved much work. Maybe there is a better way. Please share if you find a way.
1. I took my primary query with the calculations (e.g. A to C, A to B, and B to C) and duplicated (or referenced) them about 4 times, naming each of the duplicates as follows: Mean, Mean Segmented, Percentile, Percentile Segmented.
2. For each of the queries, I created a Category Field and named them accordingly (Mean, Mean Segmented, Percentile, Percentile Segmented).
3. For the Mean and Percentile Queries, I ripped out the calculations "A to B" and "B to C". Also, in each query, I relabeled the "A to B" calculation. For example, in the Mean Query, I labeled the column as "A to B Mean" and in the Percentile query, I renamed it as "A to B Percentile.
4. For the queries Mean Segmented and Percentile Segmented, I ripped out the "A to C" calculation column. Then, I renamed the remaining calculation columns, similar to the method I used in Step 3.
5. I duplicated the Mean Query and then renamed it "Combo".
6. I appended the following queries to the Combo Query: Mean Segmented, Percentile, Percentile Segmented.
7. Close and Save.
8. I located the following in the fields pane: "A to C Percentile", "A to B Percentile", and "B to C Percentile". For each of these, I created a measure to calculate the 95th percentile.
9. In the Visualization Pane, I chose stacked column chart.
10. I drug "Category" from the Combo query into the AXIS field.
11. I drug the following fields into the VALUE field and set them to AVERAGES: A to C Mean, A to B Mean, B to C Mean.
12. I drug the following MEASUREMENT fields into the VALUE field: A to C percentile, A to B percentile, and B to C percentile.
I hope this helps!