Fabric Data Days starts November 4th!
Advance your Data & AI career with 50 days of live learning, dataviz contests, hands-on challenges, study groups & certifications and more!
Get registered- Power BI forums
- Get Help with Power BI
- Desktop
- Service
- Report Server
- Power Query
- Mobile Apps
- Developer
- DAX Commands and Tips
- Custom Visuals Development Discussion
- Health and Life Sciences
- Power BI Spanish forums
- Translated Spanish Desktop
- Training and Consulting
- Instructor Led Training
- Dashboard in a Day for Women, by Women
- Galleries
- Data Stories Gallery
- Themes Gallery
- Contests Gallery
- QuickViz Gallery
- Quick Measures Gallery
- Visual Calculations Gallery
- Notebook Gallery
- Translytical Task Flow Gallery
- TMDL Gallery
- R Script Showcase
- Webinars and Video Gallery
- Ideas
- Custom Visuals Ideas (read-only)
- Issues
- Issues
- Events
- Upcoming Events
Get Fabric Certified for FREE during Fabric Data Days. Don't miss your chance! Request now
- Power BI forums
- Forums
- Get Help with Power BI
- Desktop
- Re: Charticulator - setting Y Axis maximum value u...
- Subscribe to RSS Feed
- Mark Topic as New
- Mark Topic as Read
- Float this Topic for Current User
- Bookmark
- Subscribe
- Printer Friendly Page

- Mark as New
- Bookmark
- Subscribe
- Mute
- Subscribe to RSS Feed
- Permalink
- Report Inappropriate Content
Charticulator - setting Y Axis maximum value using a measure?
I've recently started learning Charticulator, and except for a few niggles (like being unable to change a symbol color once created), I love the customisation possibilities.
One thing I'd need is the ability to set a custom max value for my Y axis based on a different measure.
My current chart includes several superposed line glyphs, including a scatter chart with all the data and a rolling average line chart:
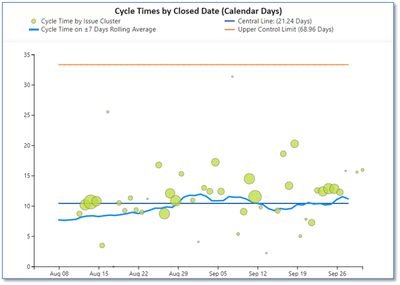
Obviously my rolling average does not have the same max value than my "all data" line so when setting both glyphs on top of each other, the Y axis don't match. As a work around I've manually set a hard coded max value for my Y Axis on all glyphs but that obviously won't work once I start using slicers to filter the data.
Any advice on this please?

- Mark as New
- Bookmark
- Subscribe
- Mute
- Subscribe to RSS Feed
- Permalink
- Report Inappropriate Content
Any updates on the problem?


- Mark as New
- Bookmark
- Subscribe
- Mute
- Subscribe to RSS Feed
- Permalink
- Report Inappropriate Content
Hi @Anonymous ,
Could you pls provide your sample .pbix file for test?Better show me your expected output.
Remember to remove the confidential information.
Best Regards,
Kelly
Did I answer your question? Mark my reply as a solution!
- Mark as New
- Bookmark
- Subscribe
- Mute
- Subscribe to RSS Feed
- Permalink
- Report Inappropriate Content
Sorry for the late reply, I've been busy with work.
See sample: https://drive.google.com/file/d/1aD668P6pDWbwiRi3UnDVMz8javLZohmF/view?usp=sharing
You will see I manually set the Y axis min and max values.
- Mark as New
- Bookmark
- Subscribe
- Mute
- Subscribe to RSS Feed
- Permalink
- Report Inappropriate Content
Hi @Anonymous ,
Do you mean that you hope the max value changed dynamically according to the slicer?
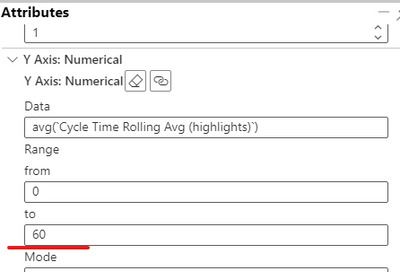
Which filter are you using?The one inside charticulator?Or Slicer below?
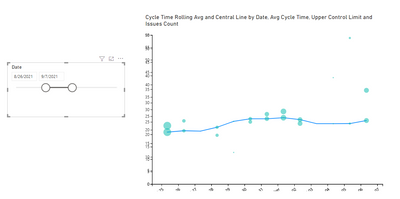
I'm a little confused about your requested output..
Best Regards,
Kelly
Did I answer your question? Mark my reply as a solution!
- Mark as New
- Bookmark
- Subscribe
- Mute
- Subscribe to RSS Feed
- Permalink
- Report Inappropriate Content
Hi @Anonymous ,
Have you checked the max value for Y axis?
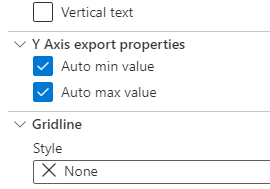
Best Regards,
Kelly
Did I answer your question? Mark my reply as a solution!
- Mark as New
- Bookmark
- Subscribe
- Mute
- Subscribe to RSS Feed
- Permalink
- Report Inappropriate Content
Thanks. I'm still a noob with charticulator so I'm probably doing something wrong.
Power BI's built in charts automatically adjusts the Y axis when there are multiple values displayed.
I've not found out how to have multiple values on the same chart in charticulator, because as far as I understand you have to drag & drop a measure on the Y axis.
So my workaround is to have multiple charts on top of each other, but obviously I need to adjust the Y axis ranges so they match.
Maybe I should have asked my question differently if my approach isn't right: how do I share the Y axis with multiple measures/values? (the X axis remains the dates table)
- Mark as New
- Bookmark
- Subscribe
- Mute
- Subscribe to RSS Feed
- Permalink
- Report Inappropriate Content
Hi @Anonymous ,
I didnt use a measure but click ... then choose edit:
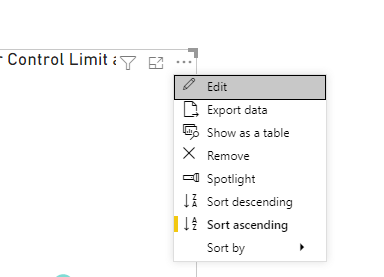
Select "Plot Segment 1">Go to attributes>Find below information>check the selections:
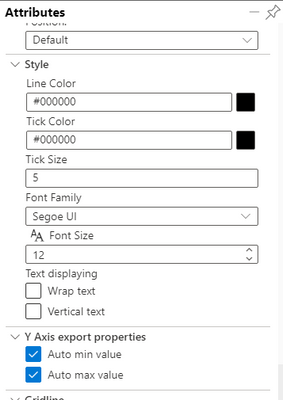
Check the reference below:
https://powerbi.microsoft.com/en-za/blog/announcing-the-new-charticulator-visual-public-preview/
Best Regards,
Kelly
Did I answer your question? Mark my reply as a solution!
- Mark as New
- Bookmark
- Subscribe
- Mute
- Subscribe to RSS Feed
- Permalink
- Report Inappropriate Content
I'm sorry, I don't know if I can't explain what I'm after or if I'm missing something obvious.
If I set Auto Max value for both axis, my first chart (scatter plott) Y axis ranges from 0 to 6, so my chart is pretty much empty. (I have to manually set the range to 0-60 to see all bubbles)
So the auto-values don't work as they don't sync up with one another.
- Mark as New
- Bookmark
- Subscribe
- Mute
- Subscribe to RSS Feed
- Permalink
- Report Inappropriate Content
Hi @Anonymous ,
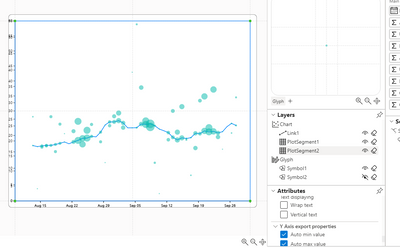
But from the test here,if you set auto for Y axis for each Plot(in your sample .pbix file,there are 2),they will all show in the visual,is below what you are after?Or you just wanna get one Y axis which contains the max value from 2 plots?
Best Regards,
Kelly
Did I answer your question? Mark my reply as a solution!
- Mark as New
- Bookmark
- Subscribe
- Mute
- Subscribe to RSS Feed
- Permalink
- Report Inappropriate Content
Thanks for coming back to me.
Seeing as I have multiple plots on top of each other (I know only 2 in the file I sent), I need to find a way to align the Y axis. They're all set to manually start at 0, so this side is fine, but I also want to align the max. Not via a slicer, but via a measure that would calculate the max for the chart that would have the bigger fluctuation.
So in the screenshot you provided, how do I set the value 60 to be dynamic pls?
IfF this isn't possible, is there a way to use a generic Y axis that I could reuse for multiple charts?
thanks

- Mark as New
- Bookmark
- Subscribe
- Mute
- Subscribe to RSS Feed
- Permalink
- Report Inappropriate Content
Hey @Anonymous,
Did you manage to find a solution? I want to do the same and have multiple series on the same Y-Axis - but can't find a way to make it work.
Thanks,
Simon
- Mark as New
- Bookmark
- Subscribe
- Mute
- Subscribe to RSS Feed
- Permalink
- Report Inappropriate Content
Hi @sstockda
I'm afraid no. Another project has taken priority so this has been left for now.
I'm thinking of whether I should create a measure that calculates axis elements up to the maxmum of all series and use this as a Y axis (pretty much the way the date axis is separate from each measure annd pulled from a separate Dates table) but not sure how to ensure each value exists in the Y Axis values table...
Do post an update here if you manage to achieve "our" goal


- Mark as New
- Bookmark
- Subscribe
- Mute
- Subscribe to RSS Feed
- Permalink
- Report Inappropriate Content
I have the same question. I would assume it should be the first problem anyone would encounter when having more than one plot segments. I have two lines that are not categories (two distinct measures), and they need to be plotted on the same XY space, but inevitably the second plot segment will show a different Y range than the first one.
Any help would be valuable!
Thanks!
Helpful resources

Power BI Monthly Update - November 2025
Check out the November 2025 Power BI update to learn about new features.

Fabric Data Days
Advance your Data & AI career with 50 days of live learning, contests, hands-on challenges, study groups & certifications and more!

FabCon Atlanta 2026
Join us at FabCon Atlanta, March 16-20, for the ultimate Fabric, Power BI, AI and SQL community-led event. Save $200 with code FABCOMM.


