FabCon is coming to Atlanta
Join us at FabCon Atlanta from March 16 - 20, 2026, for the ultimate Fabric, Power BI, AI and SQL community-led event. Save $200 with code FABCOMM.
Register now!- Power BI forums
- Get Help with Power BI
- Desktop
- Service
- Report Server
- Power Query
- Mobile Apps
- Developer
- DAX Commands and Tips
- Custom Visuals Development Discussion
- Health and Life Sciences
- Power BI Spanish forums
- Translated Spanish Desktop
- Training and Consulting
- Instructor Led Training
- Dashboard in a Day for Women, by Women
- Galleries
- Data Stories Gallery
- Themes Gallery
- Contests Gallery
- Quick Measures Gallery
- Notebook Gallery
- Translytical Task Flow Gallery
- TMDL Gallery
- R Script Showcase
- Webinars and Video Gallery
- Ideas
- Custom Visuals Ideas (read-only)
- Issues
- Issues
- Events
- Upcoming Events
Calling all Data Engineers! Fabric Data Engineer (Exam DP-700) live sessions are back! Starting October 16th. Sign up.
- Power BI forums
- Forums
- Get Help with Power BI
- Desktop
- Re: Chart with constant limits
- Subscribe to RSS Feed
- Mark Topic as New
- Mark Topic as Read
- Float this Topic for Current User
- Bookmark
- Subscribe
- Printer Friendly Page


- Mark as New
- Bookmark
- Subscribe
- Mute
- Subscribe to RSS Feed
- Permalink
- Report Inappropriate Content
Chart with constant limits
I have a table of data for which I want to create an upper limit based on the last 6 calendar month of data per category. See example:
| Issued Date | Type | Count |
| 2/5/2022 | New | 234 |
| 4/2/2022 | Rework | 45 |
| 11/9/2022 | New | 44 |
| 1/5/2023 | Returned | 7 |
| 2/9/2023 | Completed | 500 |
I want to show the mean for ever six month per category. For example: the code would check the data for type (New), but only for dates of (July 2022 - Dec 2022). I tried a measure and it gave the right value when tested in a label, but once I add it to a chart it changes every month.
6M_H1_2023_New Mean =
VAR StartDate = DATE(2022, 7, 1)
VAR EndDate = DATE(2022, 12, 30)

RETURN
DIVIDE(
    CALCULATE(
        COUNTROWS('Records Sheet'),
        'Records Sheet'[Type] = "New",
        'Records Sheet'[Issued Date] >= StartDate,
        'Records Sheet'[Issued Date] <= EndDate
    ),
    6,
    0
)
Also, what is the best way to have avoid creating a measure for every category every 6 month for limits?
- Mark as New
- Bookmark
- Subscribe
- Mute
- Subscribe to RSS Feed
- Permalink
- Report Inappropriate Content
@parry2k So, you care saying instead of using the date field in the data, create a separate calendar table to have the same dates and use that table instead?


- Mark as New
- Bookmark
- Subscribe
- Mute
- Subscribe to RSS Feed
- Permalink
- Report Inappropriate Content
@Beho are you following this 👇 which I mentioned in my reply earlier
and wherever you are visualization date data, use a column from the calendar dimension.
Subscribe to the @PowerBIHowTo YT channel for an upcoming video on List and Record functions in Power Query!!
Learn Power BI and Fabric - subscribe to our YT channel - Click here: @PowerBIHowTo
If my solution proved useful, I'd be delighted to receive Kudos. When you put effort into asking a question, it's equally thoughtful to acknowledge and give Kudos to the individual who helped you solve the problem. It's a small gesture that shows appreciation and encouragement! ❤
Did I answer your question? Mark my post as a solution. Proud to be a Super User! Appreciate your Kudos 🙂
Feel free to email me with any of your BI needs.
- Mark as New
- Bookmark
- Subscribe
- Mute
- Subscribe to RSS Feed
- Permalink
- Report Inappropriate Content
I still need some help with this one. To summarize the scenario I have. I have daily data with some categories, that I am trying to use to create monthly sum, and then a 6 month rolling average based on the monthly sum (based on 6 month of monthly data with 6-month gap). I would create separate measures for the different categories and get the monthly mean accordingly. I have tried several methods and DAX and they either return the daily average or just a blank value.
- Mark as New
- Bookmark
- Subscribe
- Mute
- Subscribe to RSS Feed
- Permalink
- Report Inappropriate Content
@Beho it shouldn't, it should show a flat line for all the dates. Please provide more details or pbix file to look into it.
Subscribe to the @PowerBIHowTo YT channel for an upcoming video on List and Record functions in Power Query!!
Learn Power BI and Fabric - subscribe to our YT channel - Click here: @PowerBIHowTo
If my solution proved useful, I'd be delighted to receive Kudos. When you put effort into asking a question, it's equally thoughtful to acknowledge and give Kudos to the individual who helped you solve the problem. It's a small gesture that shows appreciation and encouragement! ❤
Did I answer your question? Mark my post as a solution. Proud to be a Super User! Appreciate your Kudos 🙂
Feel free to email me with any of your BI needs.
- Mark as New
- Bookmark
- Subscribe
- Mute
- Subscribe to RSS Feed
- Permalink
- Report Inappropriate Content
Hi Parry2k,
I tried adding the DAX as a measure and it wouldn't allow me to select the date field, so I added a calculated column:
6MM_Execution Erron Mean =
VAR EndDate = IF ( MONTH ( 'Records Sheet'[Issued Date] ) <= 6, DATE ( YEAR ( 'Records Sheet'[Issued Date] ) - 1, 12, 31 ), DATE ( YEAR ( 'Records Sheet'[Issued Date] ), 6, 30 ) )
VAR StartDate = EOMONTH ( EndDate, -6 ) + 1

RETURN
DIVIDE(
    CALCULATE(
        COUNTROWS('Records Sheet'),
        'Records Sheet'[Type] = "Execution Error",
        'Records Sheet'[Issued Date] >= StartDate,
        'Records Sheet'[Issued Date] <= EndDate
    ),
    6,
    0
)
And when I add this column in my chart, it doesn't add anything.
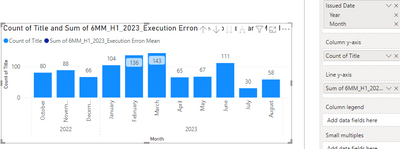
Is that the right way to approach it? if I want to do it as a measure, is there a way to workaround not being able to select it.
- Mark as New
- Bookmark
- Subscribe
- Mute
- Subscribe to RSS Feed
- Permalink
- Report Inappropriate Content
@Beho so the last 6 months are based on today's date, then it becomes super easy:
Measure =
VAR __Today = TODAY ()
VAR __MaxDate = IF ( MONTH ( __Today ) <= 6, DATE ( YEAR ( __Today ) - 1, 12, 31 ), DATE ( YEAR ( __Today ), 6, 30 ) )
VAR __MinDate = EOMONTH ( __MaxDate, -6 ) + 1
RETURN
CALCULATE (
    [Your Measure],
    DATESBETWEEN ( 'Calendar'[Date], __MinDate, __MaxDate )
)
Subscribe to the @PowerBIHowTo YT channel for an upcoming video on List and Record functions in Power Query!!
Learn Power BI and Fabric - subscribe to our YT channel - Click here: @PowerBIHowTo
If my solution proved useful, I'd be delighted to receive Kudos. When you put effort into asking a question, it's equally thoughtful to acknowledge and give Kudos to the individual who helped you solve the problem. It's a small gesture that shows appreciation and encouragement! ❤
Did I answer your question? Mark my post as a solution. Proud to be a Super User! Appreciate your Kudos 🙂
Feel free to email me with any of your BI needs.
- Mark as New
- Bookmark
- Subscribe
- Mute
- Subscribe to RSS Feed
- Permalink
- Report Inappropriate Content
I like the idea of calculating the dates instead of having them as part of the equation. Other than this part, the formula is the same as the one I have in the original post. When I tried that it worked in a label, but if I add it to a chart, it is not static, it has a different value every day still somehow.
- Mark as New
- Bookmark
- Subscribe
- Mute
- Subscribe to RSS Feed
- Permalink
- Report Inappropriate Content
@Beho what is the logic when to pick Jan - Jun or Jul - Dec? Regardless your calendar table is going to be the key if you provide the full logic.
Subscribe to the @PowerBIHowTo YT channel for an upcoming video on List and Record functions in Power Query!!
Learn Power BI and Fabric - subscribe to our YT channel - Click here: @PowerBIHowTo
If my solution proved useful, I'd be delighted to receive Kudos. When you put effort into asking a question, it's equally thoughtful to acknowledge and give Kudos to the individual who helped you solve the problem. It's a small gesture that shows appreciation and encouragement! ❤
Did I answer your question? Mark my post as a solution. Proud to be a Super User! Appreciate your Kudos 🙂
Feel free to email me with any of your BI needs.
- Mark as New
- Bookmark
- Subscribe
- Mute
- Subscribe to RSS Feed
- Permalink
- Report Inappropriate Content
I need to have a static limit for the data that is based on the last 6 calendar months (if month is Jan -June, the limit is July-Dec (previous year), and if month is Jule-Dec, the limit is (Jan - June (same year)). I get the mean, then standard deviation, and then I can establish an upper action limit (action limit = x3 Standard deviation). Hence, the limit needs to be a straight line that changes every 6 month.
- Mark as New
- Bookmark
- Subscribe
- Mute
- Subscribe to RSS Feed
- Permalink
- Report Inappropriate Content
As a best practice, add a date dimension in your model and use it for time intelligence calculations. Once the date dimension is added, mark it as a date table on table tools. Check the related videos on my YT channel
Add Date Dimension
Importance of Date Dimension
Mark date dimension as a date table - why and how?
Time Intelligence Playlist
and now you can easily add a measure like this:
Last 6 Months =
CALCULATE (
   COUNTROWS ( Table ),
   DATESINPERIOD ( 'Calendar'[Date], MAX( 'Calender'[Date] ), -6, MONTH )
)
and wherever you are visualization date data, use a column from the calendar dimension.
Subscribe to the @PowerBIHowTo YT channel for an upcoming video on List and Record functions in Power Query!!
Learn Power BI and Fabric - subscribe to our YT channel - Click here: @PowerBIHowTo
If my solution proved useful, I'd be delighted to receive Kudos. When you put effort into asking a question, it's equally thoughtful to acknowledge and give Kudos to the individual who helped you solve the problem. It's a small gesture that shows appreciation and encouragement! ❤
Did I answer your question? Mark my post as a solution. Proud to be a Super User! Appreciate your Kudos 🙂
Feel free to email me with any of your BI needs.
- Mark as New
- Bookmark
- Subscribe
- Mute
- Subscribe to RSS Feed
- Permalink
- Report Inappropriate Content
I read about the date table, and that is my plan if the direct measure doesn't work. My issue is that it's not based on the last 6 month, the limits are either Jan - Jun or July - Dec. I don't understand why my measure is changing with the daily data, even though I specified the start and end in the formula.
I am also testing a calender table with a start and end month for each day, where I can add a column for mean and use the formula to look at the date and use the start and end dates to make a fixed 6 month fixed lines. I was hoping the measure idea works as it's faster.
I will take a look at the videos to see if I can apply the same to my scenario.

Helpful resources

FabCon Global Hackathon
Join the Fabric FabCon Global Hackathon—running virtually through Nov 3. Open to all skill levels. $10,000 in prizes!

Power BI Monthly Update - September 2025
Check out the September 2025 Power BI update to learn about new features.

FabCon Atlanta 2026
Join us at FabCon Atlanta, March 16-20, for the ultimate Fabric, Power BI, AI and SQL community-led event. Save $200 with code FABCOMM.


