Forum Discussion

Change Data Bar name in visualization
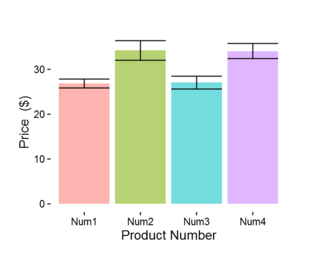
Hi, i want to change the data bar name in visualization given below ie Num1 to State-1, Num2 to State-3. how can i do it. please help.
Anonymous
You can create a new column where you will change the values to the ones you want and then add this column to the graph.
New_Column =
SUBSTITUTE (
  SUBSTITUTE (
    SUBSTITUTE (
        SUBSTITUTE ( 'Table'[Column1], "Num1", "State-1" ),
        "Num2",
        "State-2"
    ),
    "Num3",
    "State-3"
  ),"Num4",
    "State-4"
)- Anonymous7 years ago
Hi Anonymous,
You can use switch statement for this.....
NewColuimn = SWITCH(Table[Column] ,
"Num1","State-1",
"Num2","State-2",
"Num3","State-3","Table[Column]")
Or you can use if statement.
Best Regards,
Ravi

2 Replies
- themistoklisCommunity Champion
Anonymous
You can create a new column where you will change the values to the ones you want and then add this column to the graph.
New_Column =
SUBSTITUTE (
  SUBSTITUTE (
    SUBSTITUTE (
        SUBSTITUTE ( 'Table'[Column1], "Num1", "State-1" ),
        "Num2",
        "State-2"
    ),
    "Num3",
    "State-3"
  ),"Num4",
    "State-4"
) - AnonymousNot applicable
Hi Anonymous,
You can use switch statement for this.....
NewColuimn = SWITCH(Table[Column] ,
"Num1","State-1",
"Num2","State-2",
"Num3","State-3","Table[Column]")
Or you can use if statement.
Best Regards,
Ravi