Forum Discussion

 Helper II
Cannot have individual values in a chart. Values are always aggregate.
Hello,
I am going through this tutorial https://support.powerbi.com/knowledgebase/articles/471597
The problem is that the UnitsInStock is always an aggregate. I cannot have individual values in the report. Only cout or sum etc. What step am I missing?

Hi Allan
I have not got time to look at your file. But what I suggest is you do this
Go into ----> Home / Edit Queries / Transform / Data Types
And see what Data Type your relevant columns have been set to
What I think is one is set as Text (UnitsInStock) and the other one as a value
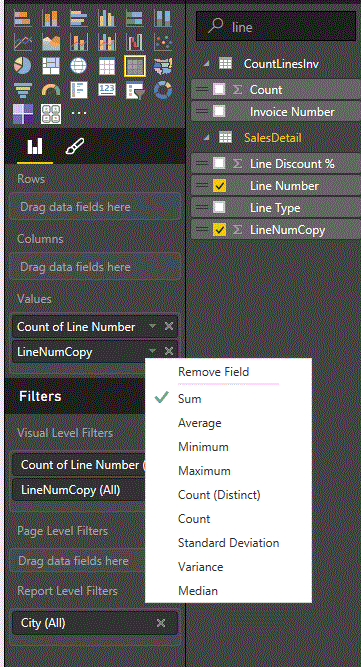
You can see the difference below. One lineNumber I have set as text (Line Number) and one as a number (Line NumCopy). This is clearly shown by the symbol verse missing symbol between the tick box and the file name)
THE ONLY THING POWER BI CAN DO WITH TEXT IS A COUNT or countdistinct if its dragged into a value box. Thats why it shows as count'
Whereas a column set as a number format can be summed Averaged etc as shown below. (For some reason this does not show in the box as SumLineNumCopy. I assume the reason for this is to clealry show Text entries as opposed to non text entries)
So what you might need to do is change the UnitsInStock to a number format
If this isn't the issue someone else will have to help you out

18 Replies
 jmanganoNew Member
I am having the same problem, did you figure this out?
- Greg_Deckler
Community Champion
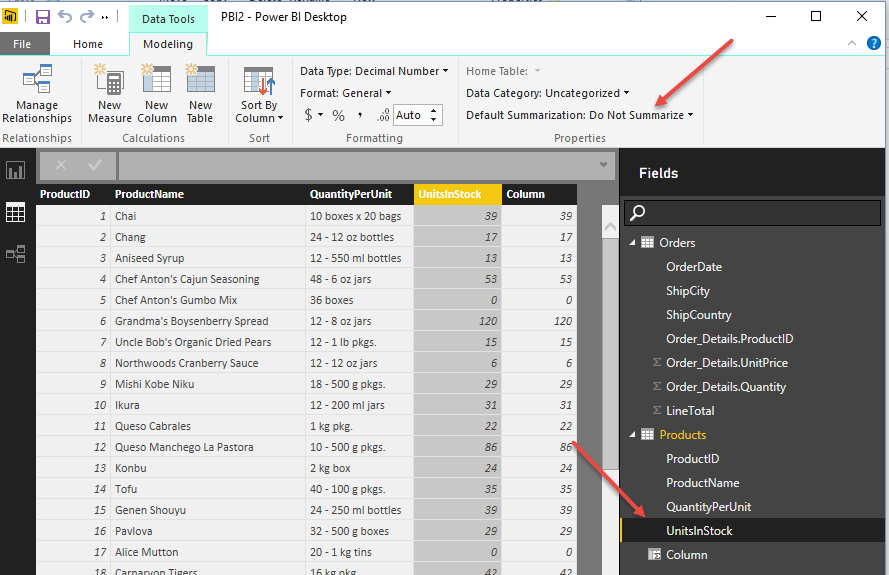
I believe what you want to do is that in the data model in the Desktop set the column to "Do not summarize".
 AllanXu
Do not summerize is the exact setup: