Forum Discussion

Cannot have individual values in a chart. Values are always aggregate.

 10 years ago
Hi Allan
I have not got time to look at your file. But what I suggest is you do this
Go into ----> Home / Edit Queries / Transform / Data Types
And see what Data Type your relevant columns have been set to
What I think is one is set as Text (UnitsInStock) and the other one as a value
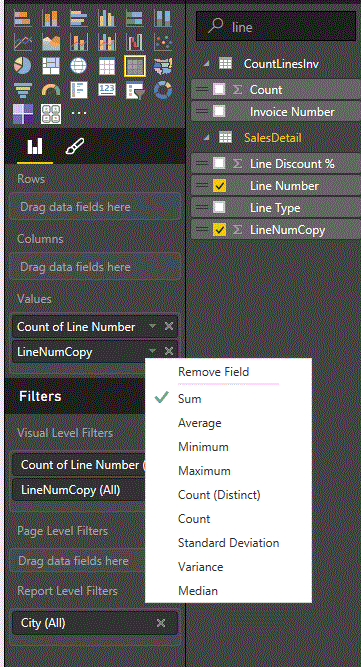
You can see the difference below. One lineNumber I have set as text (Line Number) and one as a number (Line NumCopy). This is clearly shown by the symbol verse missing symbol between the tick box and the file name)
THE ONLY THING POWER BI CAN DO WITH TEXT IS A COUNT or countdistinct if its dragged into a value box. Thats why it shows as count'
Whereas a column set as a number format can be summed Averaged etc as shown below. (For some reason this does not show in the box as SumLineNumCopy. I assume the reason for this is to clealry show Text entries as opposed to non text entries)
So what you might need to do is change the UnitsInStock to a number format
If this isn't the issue someone else will have to help you out

Hi RJ,
I do appreciate you are taking the time and helping me. I thank you for that.
I think the issues is that I am bringing the above example a proof that two numeric fields appear differently in the value. One of them is aggregation, the other of is not.
So the statement "Any field whatsover in the VALUE box will always be an aggregation" does not align with the example above. That is why I posted this question and obviously I am missing something.
I uploaded a PBI file that reproduces the problem. Also, I spent time to bring a number of annotated screenshots that elaborate the question. I suggest the screenshots and the PowerBI file should not be disregarded. They clearly show a symptom that proofs “VALUE box will NOT always be an aggregation”
If I am missing any point, please let me know. That is why I posted this question. I like to know Why (and how) VALUE box will NOT always be an aggregation accoding to the downloadable example and the screenshots in this post? What am I missing here?
Thank you,
Hi Allan
I have not got time to look at your file. But what I suggest is you do this
Go into ----> Home / Edit Queries / Transform / Data Types
And see what Data Type your relevant columns have been set to
What I think is one is set as Text (UnitsInStock) and the other one as a value
You can see the difference below. One lineNumber I have set as text (Line Number) and one as a number (Line NumCopy). This is clearly shown by the symbol verse missing symbol between the tick box and the file name)
THE ONLY THING POWER BI CAN DO WITH TEXT IS A COUNT or countdistinct if its dragged into a value box. Thats why it shows as count'
Whereas a column set as a number format can be summed Averaged etc as shown below. (For some reason this does not show in the box as SumLineNumCopy. I assume the reason for this is to clealry show Text entries as opposed to non text entries)
So what you might need to do is change the UnitsInStock to a number format
If this isn't the issue someone else will have to help you out
 yetanothertool10 years agoNew Member
It seems that Power BI is using aggregation by default therefore, requiring further steps in obtaining patterns of (raw) individual data. This is an inversion of what other software and good practices usually do. In my opinion it is wrong to use sufficient statistics before seeing the patterns in the raw data.
Here are the steps I took to obtain an individuals scatterplot chart with P BI:
1. Loaded generic data from a csv
2. Set data type to decimal
3. Added a row number column as integer
4. Selected scatterplot in report view
5. Selected the 2 decimal data columns as x and y columns aggregated to Sum by default
6. Selected the row number column as Details. This step desagregated the previous 2 columns and rendered an individuals scatteplot chart.
There are too many steps necessary to obtain something very basic. Default aggregation should be set as an option
- yetanothertool10 years agoNew Member
The result is an individuals scatterplot
- CBrandon10 years agoNew Member
Hi,
I had the same tutorial problem with 'UnitsInStock'. Thanks to all the posts I think I might have figured it out.
Setup (produced the error discussed):
1. The tutorial exercise has us change 'UnitsInStock' type to 'Whole Number' (Mine was set that way as the default).
2. Originally, the 'UnitsInStock' Default Summarization was set to 'Do Not Summarize'.*
* I'm not sure why this is the case since values in 'Orders' have the Default Summarization set to 'Sum'. Could the Excel data source have something to do with it (Format: General)?
Solution: Set the Default Summarization to: Sum.
Test:
1. Duplicate the 'UnitsInStock' field in the 'Products' table and rename it 'UIS'
2. Check to make sure the 'Type' is set to 'Whole Number'.
3.Set the Default Summarization to: Sum
4. Close & Apply
5. Test visualization described in the tutorial using UIS instead of 'UnitsInStock'.
Comment: Context is everything. I don't think anyone would consider 'UnitsInStock' as a field that one would normally aggregate. However, it seems as though the 'Default Summarization: Do Not Summarize' makes the field to act as though it were text rather than a value (Note: When UIS is plotted against UnitsInStock in a barchart, UnitsInStock are the default categories).