Huge last-minute discounts for FabCon Vienna from September 15-18, 2025
Supplies are limited. Contact info@espc.tech right away to save your spot before the conference sells out.
Get your discount- Power BI forums
- Get Help with Power BI
- Desktop
- Service
- Report Server
- Power Query
- Mobile Apps
- Developer
- DAX Commands and Tips
- Custom Visuals Development Discussion
- Health and Life Sciences
- Power BI Spanish forums
- Translated Spanish Desktop
- Training and Consulting
- Instructor Led Training
- Dashboard in a Day for Women, by Women
- Galleries
- Data Stories Gallery
- Themes Gallery
- Contests Gallery
- Quick Measures Gallery
- Notebook Gallery
- Translytical Task Flow Gallery
- TMDL Gallery
- R Script Showcase
- Webinars and Video Gallery
- Ideas
- Custom Visuals Ideas (read-only)
- Issues
- Issues
- Events
- Upcoming Events
Score big with last-minute savings on the final tickets to FabCon Vienna. Secure your discount
- Power BI forums
- Forums
- Get Help with Power BI
- Desktop
- Calculations including rows with no data
- Subscribe to RSS Feed
- Mark Topic as New
- Mark Topic as Read
- Float this Topic for Current User
- Bookmark
- Subscribe
- Printer Friendly Page


- Mark as New
- Bookmark
- Subscribe
- Mute
- Subscribe to RSS Feed
- Permalink
- Report Inappropriate Content
Calculations including rows with no data
Hello
I am working on a piece of work to identify students who are not engaging in remote learning. I am using the Microsoft Graph API's to pull usage reports from Microsoft 365. I would like to get day by day active usage of the service and more importantly show students that have now been active.
I have 2 tables the first table is an export from the School records systems and the other is the report from the graph. I have been able to match users based on the unique id which is synced for all users but im unable to get the calculations to work as i need them.
Below is how my data looks
Table 1 (Student data system report)
| Name | ID |
| User 1 | 1234 |
| User 2 | 1235 |
| User 3 | 1236 |
| User 4 | 1237 |
| User 5 | 1238 |
| User 6 | 1239 |
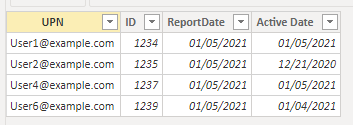
Table 2 (Microsoft Graph usage Report)
| UPN | ID | ReportDate | Active Date |
| User1@example.com | 1234 | 05/01/2021 | 05/01/2021 |
| User2@example.com | 1235 | 05/01/2021 | 21/12/2020 |
| User4@example.com | 1237 | 05/01/2021 | 05/01/2021 |
| User6@example.com | 1239 | 05/01/2021 | 04/01/2021 |
The issue im having is that now all students are showing in the usage report which i assume is due to them never being active. I need to record these students as not active. Below is the result i am trying to achieve.
| Name | ID | UPN | Active | Not Active | Active Filter |
| User 1 | 1234 | User1@example.com | 1 | Active | |
| User 2 | 1235 | User2@example.com | 1 | Not Active | |
| User 3 | 1236 | 1 | Not Active | ||
| User 4 | 1237 | User4@example.com | 1 | Active | |
| User 5 | 1238 | 1 | Not Active | ||
| User 6 | 1239 | User6@example.com | 1 | Not Active | |
| 2 | 4 |
I am able to acheive the active count using the formular below, Which i can also tweak to get the count for non active students that exist in Table 2, however i can't get this to work when i unhide blank rows.
Active
Active = IF(Table2[TeamsActiveDate] = Table2[ReportDate],1,BLANK())
Not Active
Active = IF(TAble2[TeamsActiveDate] <> Table2[ReportDate],1,BLANK())
Any help on this would be amazing


- Mark as New
- Bookmark
- Subscribe
- Mute
- Subscribe to RSS Feed
- Permalink
- Report Inappropriate Content
Hi, @AJ42
Based on your description, I created data to reproduce your scenario. The pbix file is attached in the end.
Table 1:
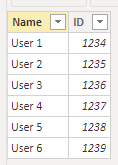
Table 2:
There is a relationship between two tables. You may create measures as below.
Active =
var tab =
SUMMARIZE(
    'Table 1',
    'Table 1'[Name],
    'Table 1'[ID],
    "Result",
    IF(
        MAX('Table 2'[ReportDate])=MAX('Table 2'[Active Date])&&MAX('Table 2'[UPN])<>"",
        1
    )
)
return
SUMX(
    tab,
    [Result]
)
Inactive =
var tab =
SUMMARIZE(
'Table 1',
'Table 1'[Name],
'Table 1'[ID],
"Result",
IF(
MAX('Table 2'[ReportDate])<>MAX('Table 2'[Active Date])||MAX('Table 2'[UPN])="",
1
)
)
return
SUMX(
tab,
[Result]
)Active Filter =
var tab =
SUMMARIZE(
'Table 1',
'Table 1'[Name],
'Table 1'[ID],
"Result",
IF(
MAX('Table 2'[ReportDate])=MAX('Table 2'[Active Date])&&MAX('Table 2'[UPN])<>"",
"Active",
"Inactive"
)
)
return
IF(
ISFILTERED('Table 1'[Name]),
MAXX(
tab,
[Result]
)
)
Result:
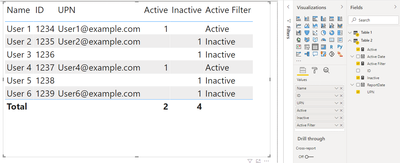
Best Regards
Allan
If this post helps, then please consider Accept it as the solution to help the other members find it more quickly.
- Mark as New
- Bookmark
- Subscribe
- Mute
- Subscribe to RSS Feed
- Permalink
- Report Inappropriate Content
Hi @v-alq-msft
Thanks you so much for that, that has almost got me there, the issue i have now which i should have put in the original post really is that i have multiple reports dates. Im pulling data from the MS graph and dumping it into SQL. So table 2 will have a ReportDate for each day. I will then need to filter based on the ReportDate but include users where they are not in that days report.
This would all be so much easier if MS Graph would report all users rather than (my guess) users that have ever been active.
- Mark as New
- Bookmark
- Subscribe
- Mute
- Subscribe to RSS Feed
- Permalink
- Report Inappropriate Content
Hi, @AJ42
Could you show us some sample data and expected result with OneDrive for Business? Do mask sensitive data before uploading. Thanks.
Best Regards
Allan
- Mark as New
- Bookmark
- Subscribe
- Mute
- Subscribe to RSS Feed
- Permalink
- Report Inappropriate Content
Hi @v-alq-msft
Thanks for getting back to me. All the data is anonymous.
ExampleData
https://1drv.ms/u/s!AlvXxzA0R_U_jwkOX096GakJCPpT?e=Hca3S4
What i have is the same as the first examples but with some added students and report dates. The issue i have is that the Microsoft Graph report i am running doesn't pull all users in the system. However if they are not showing in the Graph report then they need to be classed as inactive for each reported date and included in the total results.
Im am downloading the graph report (Table2) daily using powershell and importing this data into SQL for PowerBi. The Student data (Table1) is coming from the student records system.
The example you sent over before worked well for a selected day, but to be expected i guess when i added a filter to filter for a single reported date it stopped showing me all students and just students with a matching report date.
My aim is to create a visual and drill through like the below, which includes all of the students and not just the graph exported students (Table2).
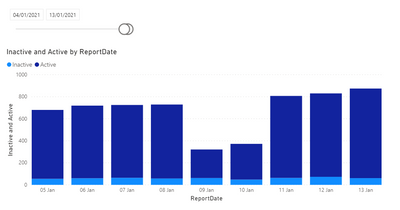
Thanks again for your help

- Mark as New
- Bookmark
- Subscribe
- Mute
- Subscribe to RSS Feed
- Permalink
- Report Inappropriate Content
Hi,
I tried implementing using the data you provided and it can be done using M query. The code is as below:
let
    MergedTable_ = Table.NestedJoin(UserTable, {"ID"}, UsageTable, {"ID"}, "UsageTable", JoinKind.LeftOuter),
    #"Expanded UsageTable" = Table.ExpandTableColumn(MergedTable_, "UsageTable", {"UPN"}, {"UsageTable.UPN"}),
    addedUsage_= List.Difference(UserTable[ID], UsageTable[ID]),
     T1_ = Table.AddColumn(Table.SelectRows(UserTable, each List.Contains(addedUsage_, [ID])), "Active Filter", each "Not active", type text),
     T2_ = Table.AddColumn(Table.SelectRows(#"Expanded UsageTable", each not List.Contains(addedUsage_, [ID])), "Active Filter", each "Active", type text),
     FinalList = Table.Combine({T1_,T2_})
in
    FinalList
The result looks something like this:

The other two columns for Active and Inactive cna be easily added based on ACtive filter column.Let me know if you want me to do it.
I hope this solves your purpose
- Mark as New
- Bookmark
- Subscribe
- Mute
- Subscribe to RSS Feed
- Permalink
- Report Inappropriate Content
HI @PC2790
Thanks you so much that looks like what i am looking for. Do you have details on how to apply this? Is this a new table or a measure? Not done anything with M query before.
Thanks
- Mark as New
- Bookmark
- Subscribe
- Mute
- Subscribe to RSS Feed
- Permalink
- Report Inappropriate Content
Here are the steps:
1) Load the two tables as usual.
2) Go to 'Transform Data' to open Query Editor
3) Click on 'New Source' and select Blan Query.
4) Delete the existing code and replace it with the code I provided.
And your job is done. You can further tweak accordig to your requirement.
I hope this solves your purpose. Please mark my post as a solution.
- Mark as New
- Bookmark
- Subscribe
- Mute
- Subscribe to RSS Feed
- Permalink
- Report Inappropriate Content
Thank you @PC2790
I got a bit stuck with this as i have multiple merged tables which i think has upset things a little. Though this has taught me how to use merged tables so thanks for that.
- Mark as New
- Bookmark
- Subscribe
- Mute
- Subscribe to RSS Feed
- Permalink
- Report Inappropriate Content
@amitchandak, Thanks for getting back to me so promptly. I think the main issue i have is i have more users in Table1 than i do in Table2. I have enebled show items with no data but i need to be able to record those as not active. Do you know if it is possible to include calculations for blank cells?


- Mark as New
- Bookmark
- Subscribe
- Mute
- Subscribe to RSS Feed
- Permalink
- Report Inappropriate Content
@AJ42 , see my HR blog with two date you can alwaus get active list of user on a date

Helpful resources

Power BI Monthly Update - August 2025
Check out the August 2025 Power BI update to learn about new features.

Fabric Community Update - August 2025
Find out what's new and trending in the Fabric community.

| User | Count |
|---|---|
| 64 | |
| 59 | |
| 47 | |
| 33 | |
| 32 |


| User | Count |
|---|---|
| 84 | |
| 75 | |
| 56 | |
| 50 | |
| 44 |


