- Power BI forums
- Updates
- News & Announcements
- Get Help with Power BI
- Desktop
- Service
- Report Server
- Power Query
- Mobile Apps
- Developer
- DAX Commands and Tips
- Custom Visuals Development Discussion
- Health and Life Sciences
- Power BI Spanish forums
- Translated Spanish Desktop
- Power Platform Integration - Better Together!
- Power Platform Integrations (Read-only)
- Power Platform and Dynamics 365 Integrations (Read-only)
- Training and Consulting
- Instructor Led Training
- Dashboard in a Day for Women, by Women
- Galleries
- Community Connections & How-To Videos
- COVID-19 Data Stories Gallery
- Themes Gallery
- Data Stories Gallery
- R Script Showcase
- Webinars and Video Gallery
- Quick Measures Gallery
- 2021 MSBizAppsSummit Gallery
- 2020 MSBizAppsSummit Gallery
- 2019 MSBizAppsSummit Gallery
- Events
- Ideas
- Custom Visuals Ideas
- Issues
- Issues
- Events
- Upcoming Events
- Community Blog
- Power BI Community Blog
- Custom Visuals Community Blog
- Community Support
- Community Accounts & Registration
- Using the Community
- Community Feedback
Register now to learn Fabric in free live sessions led by the best Microsoft experts. From Apr 16 to May 9, in English and Spanish.
- Power BI forums
- Forums
- Get Help with Power BI
- Desktop
- Calculation of tenure, Member_Month and PMPM
- Subscribe to RSS Feed
- Mark Topic as New
- Mark Topic as Read
- Float this Topic for Current User
- Bookmark
- Subscribe
- Printer Friendly Page
- Mark as New
- Bookmark
- Subscribe
- Mute
- Subscribe to RSS Feed
- Permalink
- Report Inappropriate Content
Calculation of tenure, Member_Month and PMPM
Hello everyone in this great community, I bringing a new challenger that I have to see who can help me.
I have a Members table similar to the following sample:
| Member_ID | Member_Name | Month | Membership_type |
| Mbr1 | Member1 | 1 | Gold |
| Mbr1 | Member1 | 2 | Gold |
| Mbr1 | Member1 | 3 | Gold |
| Mbr1 | Member1 | 4 | Gold |
| Mbr2 | Member2 | 3 | Gold |
| Mbr2 | Member2 | 4 | Gold |
| Mbr2 | Member2 | 5 | Gold |
| Mbr2 | Member2 | 6 | Gold |
| Mbr2 | Member2 | 7 | Gold |
| Mbr2 | Member2 | 8 | Gold |
| Mbr2 | Member2 | 9 | Gold |
| Mbr3 | Member3 | 1 | Silver |
| Mbr3 | Member3 | 2 | Silver |
| Mbr4 | Member4 | 2 | Silver |
| Mbr4 | Member4 | 3 | Silver |
| Mbr4 | Member4 | 4 | Silver |
| Mbr4 | Member4 | 5 | Silver |
| Mbr5 | Member5 | 1 | Bronze |
| Mbr5 | Member5 | 2 | Bronze |
| Mbr5 | Member5 | 3 | Bronze |
| Mbr5 | Member5 | 4 | Bronze |
| Mbr5 | Member5 | 5 | Bronze |
| Mbr5 | Member5 | 6 | Bronze |
I need calculate Tenure by member as count of how many months each Member_ID has. Example, tenure for Mbr1 is 4, Mbr2 is 7, Mbr3 is 2, as shown below.
| Member_ID | Tenure |
| Mbr1 | 4 |
| Mbr2 | 7 |
| Mbr3 | 2 |
| Mbr4 | 4 |
| Mbr5 | 6 |
Then I need a summary as count of Member_ID by Tenure. Example, Tenure 2 has 1 count, Tenure 4 has 2 counts, Tenure 6 has 1 count and Tenure 7 has 1 count.
Then I need Member Month as the sum of the multiplication of each Tenure by the count of Member_ID in it. Example, Sum(2x1,4x2,6x1,7x1)= 23, I need that number to calculate Per Member Per Month (PMPM) cost later.
I achieved all by a "group by" query in power query that have a colunm of tenure and another one with Member_ID count and measures in DAX, the issue is it doesn't change with a slicer to filter by Membership_type.
I have another version with a DAX summary table, columns Member_Id and Tenure, as:
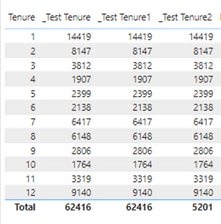
I created a relationship between this Tenure_Table and Members table by Member_Id, so now I have a visual table that changes the values for each tenure with the slicer by Membership_type. The problem here is that I don't know how to continue, to make de sum of the product Tenure x Count_by_Tenure. The sample below is the visual table that move with the slicer, the columns _Test Tenure are different formulas I used to get the count by tenure, one of them is Count_by_Tenure = AVERAGEX( KEEPFILTERS(VALUES('Tenure_Table'[Tenure])), CALCULATE(COUNTA('Tenure_Table'[Member_ID]))
I appretiate any idea, thank you in advance.
- Mark as New
- Bookmark
- Subscribe
- Mute
- Subscribe to RSS Feed
- Permalink
- Report Inappropriate Content
Hi @Luiscv73 ,
It seems that you can achieve your goal by using the sum of Tenure directly:
If I misunderstand you, Please provide me with more details about your table and your problem or share me with your pbix file after removing sensitive data.
Refer to:
How to provide sample data in the Power BI Forum
How to Get Your Question Answered Quickly
Best Regards,
Jianbo Li
Helpful resources

Microsoft Fabric Learn Together
Covering the world! 9:00-10:30 AM Sydney, 4:00-5:30 PM CET (Paris/Berlin), 7:00-8:30 PM Mexico City

Power BI Monthly Update - April 2024
Check out the April 2024 Power BI update to learn about new features.

| User | Count |
|---|---|
| 111 | |
| 94 | |
| 82 | |
| 66 | |
| 59 |
| User | Count |
|---|---|
| 151 | |
| 121 | |
| 104 | |
| 87 | |
| 67 |


