This time we’re going bigger than ever. Fabric, Power BI, SQL, AI and more. We're covering it all. You won't want to miss it.
Learn moreLevel up your Power BI skills this month - build one visual each week and tell better stories with data! Get started
Greetings,
I'm looking to calculate the % difference of change of a exchange rate between dates.
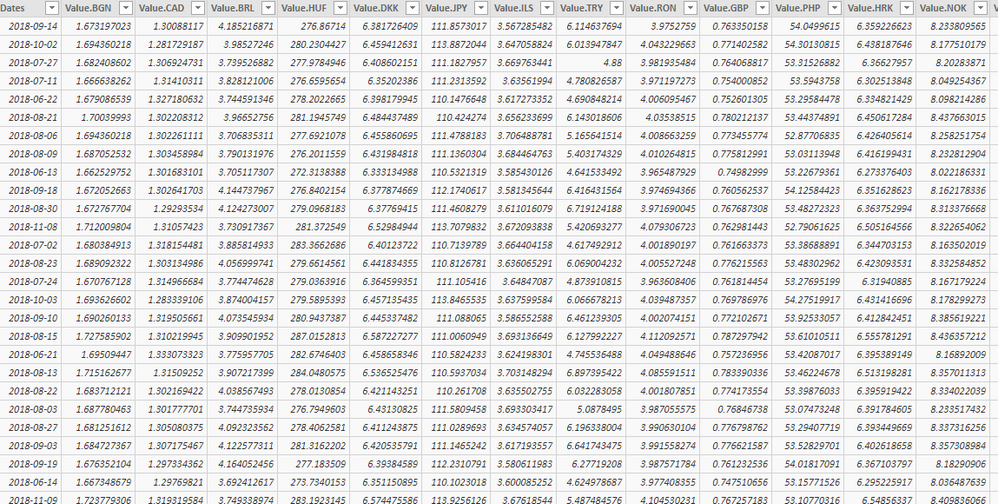
My table structure is the following:
Is it possible to calculate the % change between each row in a structure of this kind in Power BI?
I have tried this for one single column and have been unfortunately unable to figure this out. Here's my measure I created:
Solved! Go to Solution.
Hi @nnouchi,
Please try this measure:
% diff =
VAR currentmonthval =
SUM ( 'Currency rates'[Value.CAD] )
VAR previousmonthval =
CALCULATE (
SUM ( 'Currency rates'[Value.CAD] ),
FILTER (
ALLSELECTED ( 'Currency rates'[Dates] ),
MONTH ( 'Currency rates'[Dates] )
= MONTH ( MAX ( 'Currency rates'[Dates] ) ) - 1
)
)
RETURN
DIVIDE ( currentmonthval - previousmonthval, currentmonthval )
Best regards,
Yuliana Gu
Hi @nnouchi,
Please try this measure:
% diff =
VAR currentmonthval =
SUM ( 'Currency rates'[Value.CAD] )
VAR previousmonthval =
CALCULATE (
SUM ( 'Currency rates'[Value.CAD] ),
FILTER (
ALLSELECTED ( 'Currency rates'[Dates] ),
MONTH ( 'Currency rates'[Dates] )
= MONTH ( MAX ( 'Currency rates'[Dates] ) ) - 1
)
)
RETURN
DIVIDE ( currentmonthval - previousmonthval, currentmonthval )
Best regards,
Yuliana Gu
Thank you, this is exactly what I was looking to accomplish.
Check out the April 2026 Power BI update to learn about new features.
Sign up to receive a private message when registration opens and key events begin.
If you have recently started exploring Fabric, we'd love to hear how it's going. Your feedback can help with product improvements.
| User | Count |
|---|---|
| 28 | |
| 23 | |
| 22 | |
| 16 | |
| 16 |
| User | Count |
|---|---|
| 61 | |
| 35 | |
| 29 | |
| 23 | |
| 22 |