- Power BI forums
- Updates
- News & Announcements
- Get Help with Power BI
- Desktop
- Service
- Report Server
- Power Query
- Mobile Apps
- Developer
- DAX Commands and Tips
- Custom Visuals Development Discussion
- Health and Life Sciences
- Power BI Spanish forums
- Translated Spanish Desktop
- Power Platform Integration - Better Together!
- Power Platform Integrations (Read-only)
- Power Platform and Dynamics 365 Integrations (Read-only)
- Training and Consulting
- Instructor Led Training
- Dashboard in a Day for Women, by Women
- Galleries
- Community Connections & How-To Videos
- COVID-19 Data Stories Gallery
- Themes Gallery
- Data Stories Gallery
- R Script Showcase
- Webinars and Video Gallery
- Quick Measures Gallery
- 2021 MSBizAppsSummit Gallery
- 2020 MSBizAppsSummit Gallery
- 2019 MSBizAppsSummit Gallery
- Events
- Ideas
- Custom Visuals Ideas
- Issues
- Issues
- Events
- Upcoming Events
- Community Blog
- Power BI Community Blog
- Custom Visuals Community Blog
- Community Support
- Community Accounts & Registration
- Using the Community
- Community Feedback
Register now to learn Fabric in free live sessions led by the best Microsoft experts. From Apr 16 to May 9, in English and Spanish.
- Power BI forums
- Forums
- Get Help with Power BI
- Desktop
- Re: Calculate Per hour call rate by caller
- Subscribe to RSS Feed
- Mark Topic as New
- Mark Topic as Read
- Float this Topic for Current User
- Bookmark
- Subscribe
- Printer Friendly Page
- Mark as New
- Bookmark
- Subscribe
- Mute
- Subscribe to RSS Feed
- Permalink
- Report Inappropriate Content
Calculate Per hour call rate by caller
Hi All,
Can anyone please help me with creating a measure where I have to caculate number of calls by a caller per hour.
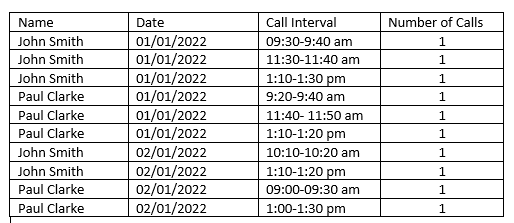
I have the dataset in given below format:
Let me know if we can create a calculated column where for Example; Based on the data, on 1st Jan John Smith has worked for 4 hours (09:30 am - 1:30 pm) and Paul Clarke has worked for 2.5 hours (9:20 am to 11:50 am) and the calls that were made on that day were 6, then the calls per hours will be 6.5/6=1.08
Please help!
Thanks in advance!
Solved! Go to Solution.
- Mark as New
- Bookmark
- Subscribe
- Mute
- Subscribe to RSS Feed
- Permalink
- Report Inappropriate Content
Hi @ashishoza12345 ,
Split Call Intervall column by delimiter in PowerQuery Editor
New table.
Table 2 = SUMMARIZE('Table','Table'[Date],'Table'[Name],"start time",MIN('Table'[Call Interval Start]),"end time",MAX('Table'[Call Interval End]))Try this column.
times = DATEDIFF('Table 2'[start time],'Table 2'[end time],SECOND)/3600Try this measure.
the calls per hours1 =
VAR _dayhours = CALCULATE(COUNT('Table'[Number of Calls]),'Table'[Date]=MAX('Table 2'[Date]))
VAR _totalphonehours = CALCULATE(SUM('Table 2'[times]),ALLEXCEPT('Table 2','Table 2'[Date]))
RETURN
_totalphonehours/_dayhour
Put measure into visual,the result should be like this.
Attach the pbix file for reference. Hope it helps.
Best Regards,
Community Support Team_Gao
If there is any post helps, then please consider Accept it as the solution to help the other members find it more quickly. If I misunderstand your needs or you still have problems on it, please feel free to let us know. Thanks a lot!
- Mark as New
- Bookmark
- Subscribe
- Mute
- Subscribe to RSS Feed
- Permalink
- Report Inappropriate Content
Hi @v-cgao-msft ,
That was a great help.
This technique did help me for what I was looking for.
Appreciate your work and Thank you once again!
- Mark as New
- Bookmark
- Subscribe
- Mute
- Subscribe to RSS Feed
- Permalink
- Report Inappropriate Content
Hi,
If I have posted a response that resolves your question, then please consider Accept it as the solution to help the other members find it more quickly. Thanks in advance.😊
Best Regards,
Community Support Team_Gao
- Mark as New
- Bookmark
- Subscribe
- Mute
- Subscribe to RSS Feed
- Permalink
- Report Inappropriate Content
Hi @ashishoza12345 ,
Split Call Intervall column by delimiter in PowerQuery Editor
New table.
Table 2 = SUMMARIZE('Table','Table'[Date],'Table'[Name],"start time",MIN('Table'[Call Interval Start]),"end time",MAX('Table'[Call Interval End]))Try this column.
times = DATEDIFF('Table 2'[start time],'Table 2'[end time],SECOND)/3600Try this measure.
the calls per hours1 =
VAR _dayhours = CALCULATE(COUNT('Table'[Number of Calls]),'Table'[Date]=MAX('Table 2'[Date]))
VAR _totalphonehours = CALCULATE(SUM('Table 2'[times]),ALLEXCEPT('Table 2','Table 2'[Date]))
RETURN
_totalphonehours/_dayhour
Put measure into visual,the result should be like this.
Attach the pbix file for reference. Hope it helps.
Best Regards,
Community Support Team_Gao
If there is any post helps, then please consider Accept it as the solution to help the other members find it more quickly. If I misunderstand your needs or you still have problems on it, please feel free to let us know. Thanks a lot!
Helpful resources

Microsoft Fabric Learn Together
Covering the world! 9:00-10:30 AM Sydney, 4:00-5:30 PM CET (Paris/Berlin), 7:00-8:30 PM Mexico City

Power BI Monthly Update - April 2024
Check out the April 2024 Power BI update to learn about new features.

| User | Count |
|---|---|
| 117 | |
| 107 | |
| 69 | |
| 68 | |
| 43 |
| User | Count |
|---|---|
| 148 | |
| 103 | |
| 103 | |
| 88 | |
| 66 |


