- Power BI forums
- Updates
- News & Announcements
- Get Help with Power BI
- Desktop
- Service
- Report Server
- Power Query
- Mobile Apps
- Developer
- DAX Commands and Tips
- Custom Visuals Development Discussion
- Health and Life Sciences
- Power BI Spanish forums
- Translated Spanish Desktop
- Power Platform Integration - Better Together!
- Power Platform Integrations (Read-only)
- Power Platform and Dynamics 365 Integrations (Read-only)
- Training and Consulting
- Instructor Led Training
- Dashboard in a Day for Women, by Women
- Galleries
- Community Connections & How-To Videos
- COVID-19 Data Stories Gallery
- Themes Gallery
- Data Stories Gallery
- R Script Showcase
- Webinars and Video Gallery
- Quick Measures Gallery
- 2021 MSBizAppsSummit Gallery
- 2020 MSBizAppsSummit Gallery
- 2019 MSBizAppsSummit Gallery
- Events
- Ideas
- Custom Visuals Ideas
- Issues
- Issues
- Events
- Upcoming Events
- Community Blog
- Power BI Community Blog
- Custom Visuals Community Blog
- Community Support
- Community Accounts & Registration
- Using the Community
- Community Feedback
Register now to learn Fabric in free live sessions led by the best Microsoft experts. From Apr 16 to May 9, in English and Spanish.
- Power BI forums
- Forums
- Get Help with Power BI
- Desktop
- CALCULATE with SELECTDISTINCT and FILTER on Existi...
- Subscribe to RSS Feed
- Mark Topic as New
- Mark Topic as Read
- Float this Topic for Current User
- Bookmark
- Subscribe
- Printer Friendly Page
- Mark as New
- Bookmark
- Subscribe
- Mute
- Subscribe to RSS Feed
- Permalink
- Report Inappropriate Content
CALCULATE with SELECTDISTINCT and FILTER on Existing Measure
Hi,
Showing my question/example in Excel to protect actual data, but I'm doing this work in BI.
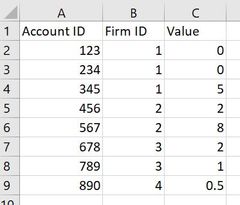
I have the following table called Accounts in a dataset:
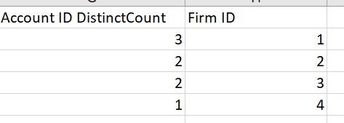
I also have a measure (Account ID DistinctCount) that gives me the DISTINCTCOUNT of Account ID's for firms:
Here is the DAX for my Account ID DistinctCount measure: DISTINCTCOUNT(Accounts[Account ID]).
This measure is working as expected.
I'm now trying to write a measure2. For measure2, I need to calculate the total number of Firms that a) have at least 2 accounts, and b) the Values of said accounts exceed 1. Given the dataset above, I'd expect my result to be 1. (Firm 2 is the only firm with at least 2 accounts whose Values exceed 1).
I tried writing this CALCULATE in DAX as follows:
- Mark as New
- Bookmark
- Subscribe
- Mute
- Subscribe to RSS Feed
- Permalink
- Report Inappropriate Content
@Anonymous - Here is one way:
Measure 2 =
    VAR __Table = SUMMARIZE('Table (2)',[Firm ID],"Count",DISTINCTCOUNT('Table (2)'[Account ID]),"Value",SUM('Table (2)'[Value]))
RETURN
    COUNTX(FILTER(__Table,[Count]>2 && [Value] > 1),[Firm ID])
@ me in replies or I'll lose your thread!!!
Instead of a Kudo, please vote for this idea
Become an expert!: Enterprise DNA
External Tools: MSHGQM
YouTube Channel!: Microsoft Hates Greg
Latest book!: The Definitive Guide to Power Query (M)
DAX is easy, CALCULATE makes DAX hard...
- Mark as New
- Bookmark
- Subscribe
- Mute
- Subscribe to RSS Feed
- Permalink
- Report Inappropriate Content
Thanks @Greg_Deckler. I'm a total newbie: what do I replace the underscores with? What is Table(2) representing?
I got this far, but stopped after several syntax flags:
- Mark as New
- Bookmark
- Subscribe
- Mute
- Subscribe to RSS Feed
- Permalink
- Report Inappropriate Content
Quick update @Greg_Deckler
I think I got the syntax down, but the result yielded was (null). Here's the query with actual referents:
SpecialFirmCount = CALCULATE(
DISTINCTCOUNT(DailyAUM[company_name]),
FILTER(DailyAUM,DailyAUM[DistinctCountAccountID])>99,
FILTER(DailyAUM,DailyAUM[AUM]>1))
- Mark as New
- Bookmark
- Subscribe
- Mute
- Subscribe to RSS Feed
- Permalink
- Report Inappropriate Content
One more update for this evening. I've literally been at this for 12 hours straight.
I created a measure that gets very close. The DAX behind the measure is as follows:
| Firm |
| Firm 1 |
| Firm 2 |
| Firm 3 |
| Firm 4 |
| Firm 5 |
But my goal is to show the number 5, not the names of the 5 firms. Since the field is a text string, I go to change it to Count (Distinct). But as soon as I do, my filter on measure CountAcctsValueGrtrThn1 goes away.
Table, filtered on my measure, correctly showing 5 results:
Table, measure filter removed, after hitting Count (Distinct)
I expected this value to show 5. But the value it shows, 59, is the total count of all Firms ("company_name"'s). It's almost as if I can't filter using multiple Count Distinct's?
Anyway, any help is appreciated. Thanks again!
- Mark as New
- Bookmark
- Subscribe
- Mute
- Subscribe to RSS Feed
- Permalink
- Report Inappropriate Content
Hi @Anonymous ,
You need a measure rather than just using count (distinctcount) in the field,could you pls upload your .pbix file(remove the confidentail information) to onedrive business and share the link with us?
Best Regards,
Kelly
- Mark as New
- Bookmark
- Subscribe
- Mute
- Subscribe to RSS Feed
- Permalink
- Report Inappropriate Content
Hi @v-kelly-msft , thanks for your response.
What's the best way to mask PII before uploading the PBIX? If you have a link to instructions, I can take a look. Thanks!
- Mark as New
- Bookmark
- Subscribe
- Mute
- Subscribe to RSS Feed
- Permalink
- Report Inappropriate Content
Hi @Anonymous ,
Just remove the confidential information or you could make a simple sample such as dragging some data from your file,then upload it to onedrive business and share the link with us.
Hope this make sense.
Kelly
- Mark as New
- Bookmark
- Subscribe
- Mute
- Subscribe to RSS Feed
- Permalink
- Report Inappropriate Content
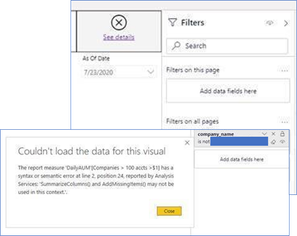
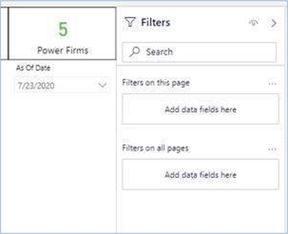
I had a colleague assist me, but have now run into a separate issue.
The DAX that solved my problem was:


- Mark as New
- Bookmark
- Subscribe
- Mute
- Subscribe to RSS Feed
- Permalink
- Report Inappropriate Content
Hi @Anonymous ,
Not quite sure without your .pbix file,try to use "summarize" in stead of "summarizecolumns"..
Kelly
Helpful resources

Microsoft Fabric Learn Together
Covering the world! 9:00-10:30 AM Sydney, 4:00-5:30 PM CET (Paris/Berlin), 7:00-8:30 PM Mexico City

Power BI Monthly Update - April 2024
Check out the April 2024 Power BI update to learn about new features.

| User | Count |
|---|---|
| 114 | |
| 97 | |
| 85 | |
| 70 | |
| 61 |
| User | Count |
|---|---|
| 151 | |
| 121 | |
| 104 | |
| 87 | |
| 67 |


