Forum Discussion

Blank Year over Year Column
Hello,
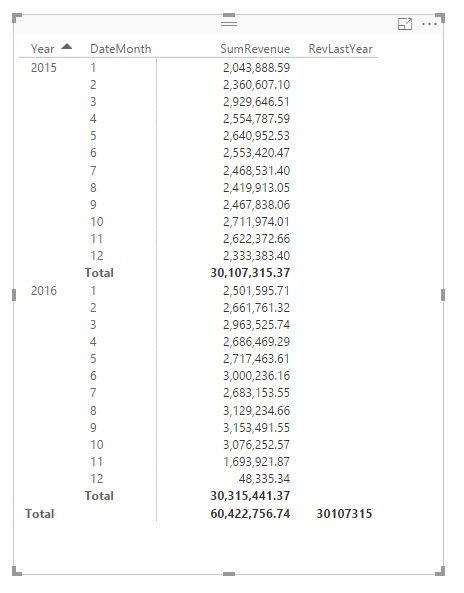
I am relatively new to Power BI so I'm still fumbling through it. I've tried to use a technique from another post, however, I continue to have an issue. As far as I can tell I have followed the steps correctly. I should be seeing 2015 results in the RevLastYear column next to 2016 as illustrated here but instead only get the Total 30107315 and that is only because I turned on Total row otherwise I have a blank RevLastYear column. I hope I provided enough information to give you an idea of what I'm up against here. Do you think you can help?
Year = YEAR(Shipments[Date])
DateMonth = MONTH(Shipments[Date])
SumRevenue = CALCULATE(SUM(Shipments[Total Revenue]))
RevLastYear = CALCULATE([SumRevenue],DATEADD(DATESYTD(Shipments[Date]),-1,YEAR))
- Anonymous9 years ago
Make sure your column Shipments[Date] is of type date value!
If you don't want to work with a separate date table and relate that table to your fact table you can still make it work by doing this instead:
Use Shipments[Date] directly in your visualization instead of using the calculations YEAR(..) and MONTH(...)
Power BI will create a date hierarchy for you automatically.
Change the meassure for RevLastYear to: CALCULATE([SumRevenue],DATEADD(Shipments[Date].[Date],-1,YEAR))
That should give you what you are looking for.
Br,
Magnus
- Anonymous9 years ago
Hi Anonymous,
You can use below formula to get the previous years' total.
Pervious Year Total =
var currDate=MAX([Date])
return
SUMX(FILTER(ALL(Shipments),Shipments[Date]>=DATE(YEAR(currDate)-1,1,1)&&Shipments[Date]<=DATE(YEAR(currDate)-1,12,31)&&MONTH([Date])=MONTH(currDate)),[Total Revenue])Pervious Year(Month/Year) =
SUMX(FILTER(ALL(Shipments),Shipments[Date]>=DATE(MAX([Year])-1,1,1)&&Shipments[Date]<=DATE(MAX([Year])-1,12,31)&&[Month]=MAX([Month])),[Total Revenue])Result:
Regards,
Xiaoxin Sheng
4 Replies
- AnonymousNot applicable
Make sure your column Shipments[Date] is of type date value!
If you don't want to work with a separate date table and relate that table to your fact table you can still make it work by doing this instead:
Use Shipments[Date] directly in your visualization instead of using the calculations YEAR(..) and MONTH(...)
Power BI will create a date hierarchy for you automatically.
Change the meassure for RevLastYear to: CALCULATE([SumRevenue],DATEADD(Shipments[Date].[Date],-1,YEAR))
That should give you what you are looking for.
Br,
Magnus
- AnonymousNot applicable
Hi Anonymous,
You can use below formula to get the previous years' total.
Pervious Year Total =
var currDate=MAX([Date])
return
SUMX(FILTER(ALL(Shipments),Shipments[Date]>=DATE(YEAR(currDate)-1,1,1)&&Shipments[Date]<=DATE(YEAR(currDate)-1,12,31)&&MONTH([Date])=MONTH(currDate)),[Total Revenue])Pervious Year(Month/Year) =
SUMX(FILTER(ALL(Shipments),Shipments[Date]>=DATE(MAX([Year])-1,1,1)&&Shipments[Date]<=DATE(MAX([Year])-1,12,31)&&[Month]=MAX([Month])),[Total Revenue])Result:
Regards,
Xiaoxin Sheng
 Thiyags
Helper II
Anonymous
Did you use SAMEPERIODLASTYEAR function?
CALCULATE(SUM(Shipments[Total Revenue]),SAMEPERIODLASTYEAR(Shipments[Date ].[Date]))
- AnonymousNot applicable
Thank you all for your responses. I am able to wrap up my project now. Thiyags I did try to use SAMEPERIODLASTYEAR but I was unable to get that to work either.