Forum Discussion

Average Products per Transaction

- 7 years ago
Hi,
Write this measure and drag it to your visual
=AVERAGEX(SUMMARIZE(VALUES(Data[Pline]),Data[Pline],"ABCD",COUNTROWS(Data)),[ABCD])
Does this help?

Hi,
In your visual drag TransactionID. Write these measures
Items sold = DISTINCTCOUNT(Data[ItemID])
Average revenue = AVERAGE(Data[Gross revenue])

Hi Ashish,
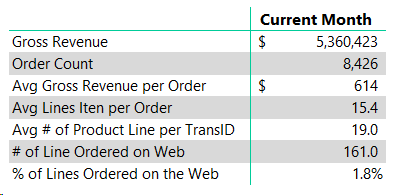
Thank you for the DAX. I've attached additional info. As you can see I have $5,360,423 in sales per month. Those sales are made up of 8,426 orders (invoices). The average Gross Revenue per order is $614 ($5,360,423 / 8,426) Average line items per order are 15.4. However, i'm not sure how to calculate the average disticnt product lines that were on each of the 8,426 invoices. I've added the DAX for all of the items for review. The "Avg # of Product Line per TransID" is incorrect since it only looks at the distinct product lines that were ordered as a whole not by transaction (or invoice). My previous post was on an invoice level and the thoughtes were that if i can come up an everage at an invoice I can then start building off of that DAX.
Thank You Ashish!
Bobi
- Ashish_Mathur7 years agoSuper User
Hi,
Please build a simple example with small numbers and show your exact answer you are expecting.
- BobiRussell7 years agoFrequent Visitor
Oka,
So here is a sample detail of 3 TransID (Invoices) that I ‘m providing for reference.
The below is a summary of that raw data. I took the raw data and calculated the distinctcount PLine for each TransID.
So below is the calculation that I wanted to get at. I took the # of Distinct Pline of each TransID and took the average of the three samples provided.
I hope that this info is easy to follow and anyone needs more info or details I can share that as well.
Thank You,
- Ashish_Mathur7 years agoSuper User
Hi,
Write this measure and drag it to your visual
=AVERAGEX(SUMMARIZE(VALUES(Data[Pline]),Data[Pline],"ABCD",COUNTROWS(Data)),[ABCD])
Does this help?