FabCon is coming to Atlanta
Join us at FabCon Atlanta from March 16 - 20, 2026, for the ultimate Fabric, Power BI, AI and SQL community-led event. Save $200 with code FABCOMM.
Register now!- Power BI forums
- Get Help with Power BI
- Desktop
- Service
- Report Server
- Power Query
- Mobile Apps
- Developer
- DAX Commands and Tips
- Custom Visuals Development Discussion
- Health and Life Sciences
- Power BI Spanish forums
- Translated Spanish Desktop
- Training and Consulting
- Instructor Led Training
- Dashboard in a Day for Women, by Women
- Galleries
- Data Stories Gallery
- Themes Gallery
- Contests Gallery
- QuickViz Gallery
- Quick Measures Gallery
- Visual Calculations Gallery
- Notebook Gallery
- Translytical Task Flow Gallery
- TMDL Gallery
- R Script Showcase
- Webinars and Video Gallery
- Ideas
- Custom Visuals Ideas (read-only)
- Issues
- Issues
- Events
- Upcoming Events
The Power BI Data Visualization World Championships is back! Get ahead of the game and start preparing now! Learn more
- Power BI forums
- Forums
- Get Help with Power BI
- Desktop
- Re: Allselected function not removing row context ...
- Subscribe to RSS Feed
- Mark Topic as New
- Mark Topic as Read
- Float this Topic for Current User
- Bookmark
- Subscribe
- Printer Friendly Page


- Mark as New
- Bookmark
- Subscribe
- Mute
- Subscribe to RSS Feed
- Permalink
- Report Inappropriate Content
Allselected function not removing row context for date hierarchy
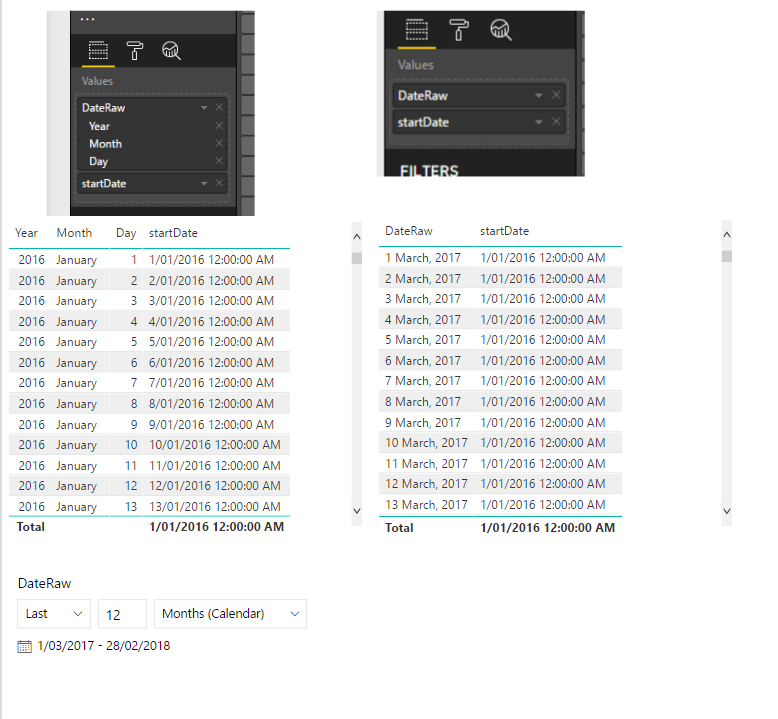
Why does AllSelected not deliver the same behaviour in the two cases below?
startDate = CALCULATE(
    FIRSTDATE('Dim Date'[DateRaw].[Date]),
    ALLSELECTED('Dim Date'[DateRaw].[Date])
)


- Mark as New
- Bookmark
- Subscribe
- Mute
- Subscribe to RSS Feed
- Permalink
- Report Inappropriate Content
I've edited this reply to remove my original answer because it was wrong. Please see my next reply.
- Mark as New
- Bookmark
- Subscribe
- Mute
- Subscribe to RSS Feed
- Permalink
- Report Inappropriate Content
Hi @Phil_Seamark I don't understand your answer. In my experience, AllSelected removes the row context and preserves the visual state (as determined by the visual). This is exactly what it does for the right-hand side version, where I selected the date rather than the date hierarchy. In this case it removes the row context and I am left with the page context as defined by the slicer. How is this different to the left hand version?
ALL and ALLEXCEPT don't help me because I need to preserve the page context.
- Mark as New
- Bookmark
- Subscribe
- Mute
- Subscribe to RSS Feed
- Permalink
- Report Inappropriate Content
You are quite correct and my answer was poor. In fact it woke me up to come and fix. The ALLSELECTED function will only remove filters from tables or columns internal to your query (visual)
The syntax you are using only removes the filter column from a specific column in the hidden date table and nothing else.
You are using ALLSELECTED to clear filters from the folloing column in your measure
Dim Date'[DateRaw].[Date]
Whereas you are ACTUALLY using the following column in your query
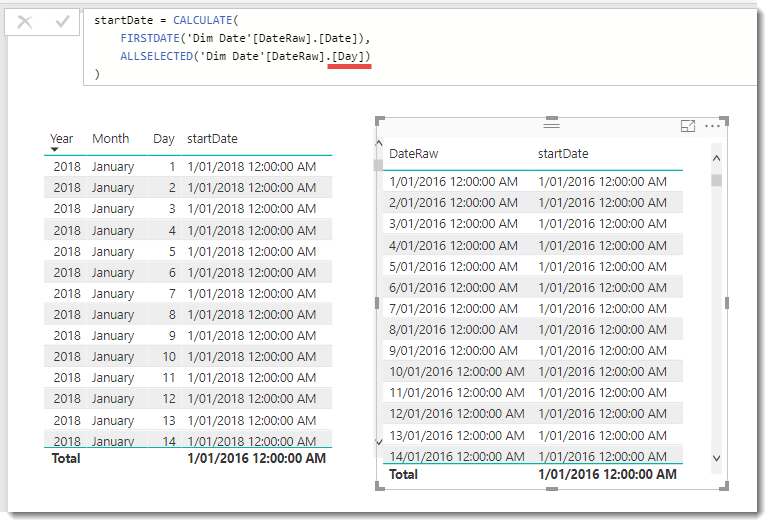
'Dim Date'[DateRaw].[Day]
There is a very subtle difference and means your ALLSELECTED function not removing the filter off the .[DAY] and this filter is being propogated back to the 'Dim Date' table and restricting the rows visible to the FIRSTDATE function.
If you change your measure to the following, your measure will now return the same value
startDate = CALCULATE(
    FIRSTDATE('Dim Date'[DateRaw].[Date]),
    ALLSELECTED('Dim Date'[DateRaw].[Day])
)
- Mark as New
- Bookmark
- Subscribe
- Mute
- Subscribe to RSS Feed
- Permalink
- Report Inappropriate Content
thanks you! I've been troubled by this behavior for the last 2 of my projects. I want to ask, please: if my slicer is in the [Year].[Month] hierarchy and my calculation is on [Day], would it be affected by the slicer? I truly don't understand this behavior. Thanks in advance!
- Mark as New
- Bookmark
- Subscribe
- Mute
- Subscribe to RSS Feed
- Permalink
- Report Inappropriate Content
Thanks for the insights, it is helping me to reason about this, even though your suggestion doesn't fix the problem. If you scroll down in your example, you will find that the start date you are calculating is actually the start date for the row month, it is not constant. Second, your method ignores any slicer on the page which defeats the purpose of the exercise.
Based on your explanation, I realised that the hierarchy, filthy hack that it is, is simply adding columns and all of these columns that are involved in the row context, need to have their filters stripped back to the visual level.
The point is, I am slicing (at page level) on 'Dim Date'[Date] but my visual is using the Date Hierarchy so I need to remove the row context from all of the hierarchy columns that are involved. There are two ways to do this...
startDate3 = CALCULATE(
    FIRSTDATE('Dim Date'[Date]),
    ALLSELECTED('Dim Date'[Date].[Year]),
    ALLSELECTED('Dim Date'[Date].[Month]),
    ALLSELECTED('Dim Date'[Date].[MonthNo]),
    ALLSELECTED('Dim Date'[Date].[Day])
)
startDate2 = CALCULATE(
FIRSTDATE('Dim Date'[Date]),
ALLSELECTED('Dim Date')
)As explained above, your suggestion, while very helpful, does not do this...
startDate = CALCULATE(
    FIRSTDATE('Dim Date'[Date].[Date]),
    ALLSELECTED('Dim Date'[Date].[Day])
)
And the results are sumarised below...
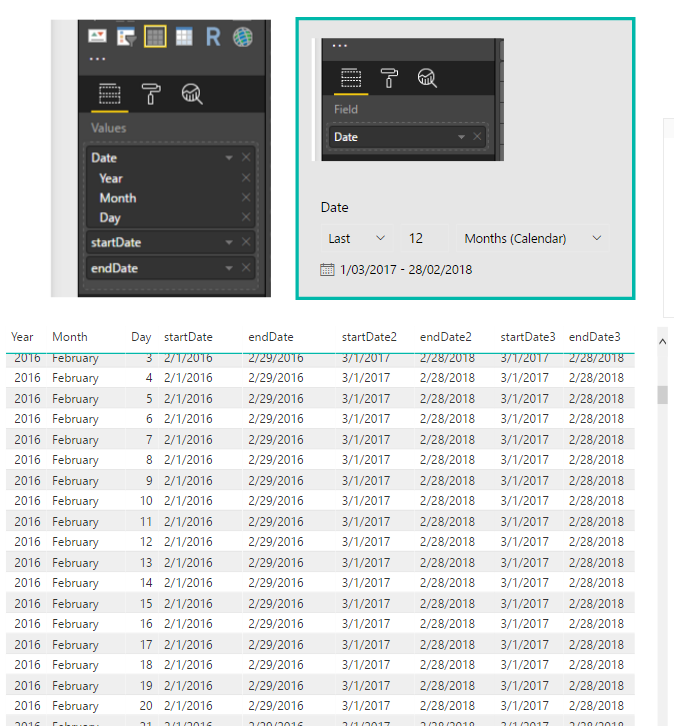
Now I have the problem though, that, because the hierarchy elements in my visual are not filtered by the slicer, I see all dates rather than all visual dates. In other words, the filthy hack of a date hierarchy doesn't propagate the date filter to the hierarchy columns AND it is not possible to use 'Dim Date'[Date].[Date] on the slicer. So, there is no way that I can see, to use the automatic hierarchy in a visual in conjunction with a slicer.
My solution was to create my own Hierarchy that includes the [Date] column and use that column in the slicer.

Then use the insights given by @Phil_Seamark to re-write the measure targeting that hierarchy...
startDate4 = CALCULATE(
    FIRSTDATE('Dim Date'[Date]),
    ALLSELECTED('Dim Date'[Year]),
    ALLSELECTED('Dim Date'[Month]),
    ALLSELECTED('Dim Date'[Month Number]),
    ALLSELECTED('Dim Date'[Day Number])
)
or, if I don't need to be so specific...
endDate2 = CALCULATE(
    LASTDATE('Dim Date'[Date]),
    ALLSELECTED('Dim Date')
)
and these work.
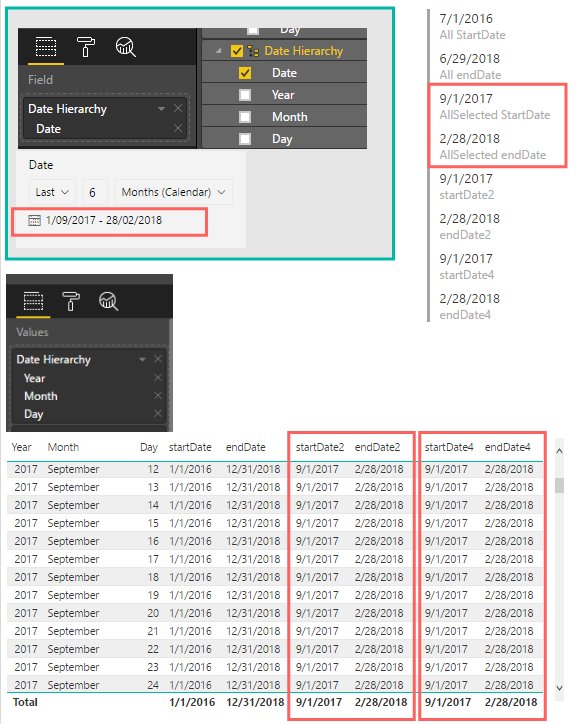
The only thing to be careful of here is the sort order for the text, Month field. You need to include a Month Number field and sort it by that...
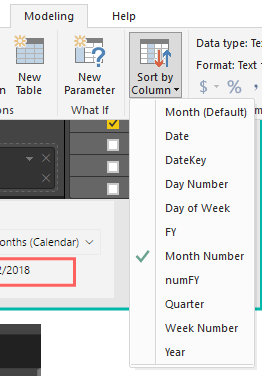
After going through all this, the Line Graph visual insists on labeling every day at the lowest level so it's impossible to see the entire picture at day-level granularity.
- Mark as New
- Bookmark
- Subscribe
- Mute
- Subscribe to RSS Feed
- Permalink
- Report Inappropriate Content
I wasn't trying to suggest a solution to a problem you were grappling with. I was just trying to explain why the two charts you posted returned different results for the same query. My suggestion was just to show how you might modify the syntax if you wanted to align the two visuals. Hopefully I was able to help shed some light on one of the finer details of DAX Data Modelling in Power BI. 🙂
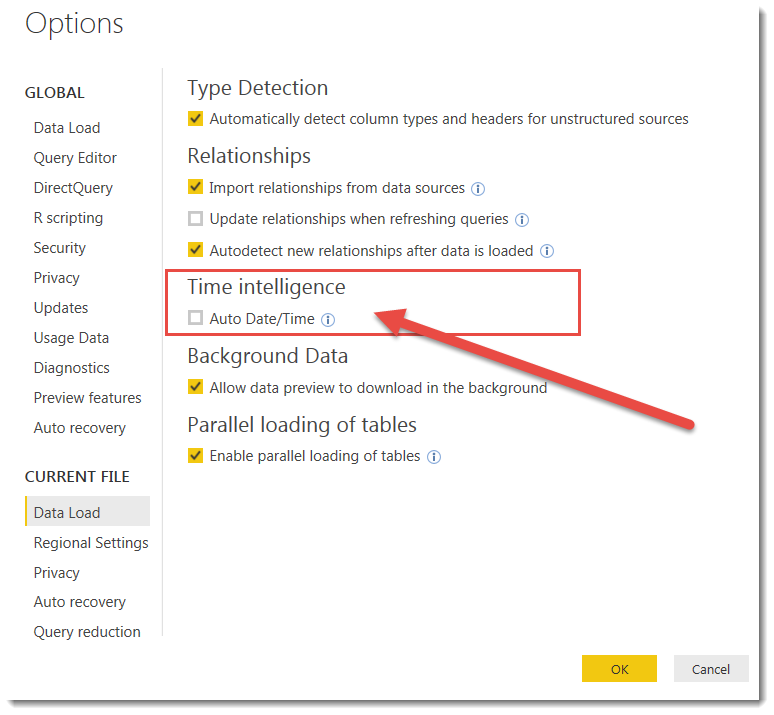
The "filty hack" that you describe actually creates entire tables in the background. Not just add columns (which I guess can be considered adding columns via a relationship). It was added to Power BI to make life easier for newer users. I'm not a fan and turn it off in the options when I'm building data models and always use my own date tables.
- Mark as New
- Bookmark
- Subscribe
- Mute
- Subscribe to RSS Feed
- Permalink
- Report Inappropriate Content
Hi @Phil_Seamark, your reply was indeed extremely helpful as I mentioned.
The only reason I use the Auto Date/Time feature is because the automatic hierarchy supports a Continuous X-axis like this...

but, if I roll my own hierarchy, it forces a Category axis...

which is anoying.
- Mark as New
- Bookmark
- Subscribe
- Mute
- Subscribe to RSS Feed
- Permalink
- Report Inappropriate Content
The axis is forced to Category mode when it's dealing with a non-Date/Time field. The field you are using at the bottom level is Integer (Day of the month).
If you use a DateTime field the axis will auto-scale
- Mark as New
- Bookmark
- Subscribe
- Mute
- Subscribe to RSS Feed
- Permalink
- Report Inappropriate Content
Yes I did try that as one of the many permutations and I got this...

But after reading your suggestion I realised there was one more permutation: using the go to next level button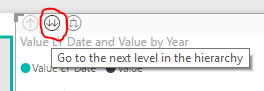
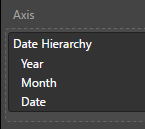
This works for the lowest level but, not for the Month level...
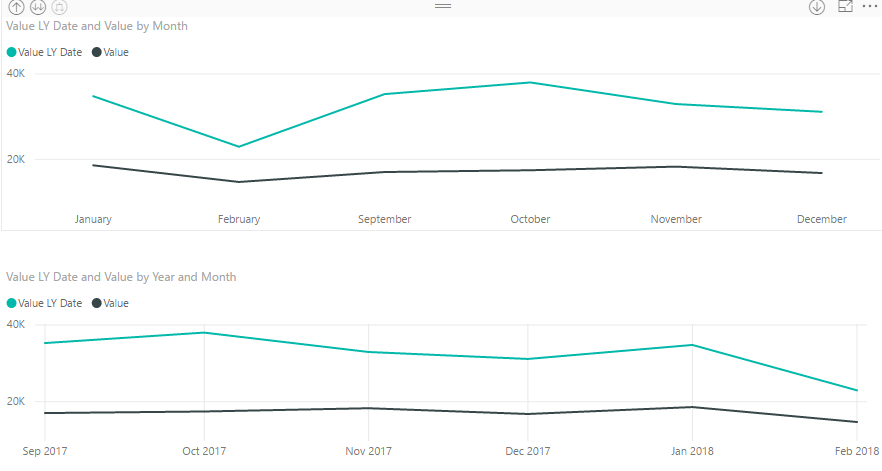
The months summarised without considering the years and even if you set the sort order to Month Number, still don't sort in order. It's like they thought of everything and systematically eliminated the options to bump their frustrated customer KPI.

Helpful resources

Power BI Dataviz World Championships
The Power BI Data Visualization World Championships is back! Get ahead of the game and start preparing now!

Power BI Monthly Update - November 2025
Check out the November 2025 Power BI update to learn about new features.

FabCon Atlanta 2026
Join us at FabCon Atlanta, March 16-20, for the ultimate Fabric, Power BI, AI and SQL community-led event. Save $200 with code FABCOMM.

| User | Count |
|---|---|
| 66 | |
| 46 | |
| 42 | |
| 26 | |
| 19 |


| User | Count |
|---|---|
| 196 | |
| 127 | |
| 102 | |
| 67 | |
| 49 |


