cancel
Showing results for 
Search instead for 
Did you mean: 

Level up your Power BI skills this month - build one visual each week and tell better stories with data! Get started

Reply
PCahill19
Frequent Visitor

Age profile of service desk data over Time

Hi, I'm new to PowerBI and looking for some help to solve the following.

I have imported the following data (This is dummy data for pupose of the question) from an Excel file. Showing Ages of service desk tickets month by month. The purpose is to create a Line chart showing age of tickets, either opened or closed within particular months.

Assignment GroupopenedclosedAgeAge to April 30thIncluded in AprilAge May 31stIncluded in MayAge June 30thIncluded in June
Group 101/02/202204/04/2022626210000
Group 101/04/2022  301611911
Group 203/05/202206/06/20223400281341
Group 301/07/202203/07/20222000000
    9228921252

I have then created a second table within PowerBI as follows, using measures from the bove table:

 Average Age
April46
May 44.5
June62.5


Whilst this works in that I can create a line chart from the new table, I am unable to add a slicer based on the first table, so that I can see the average age of tickets per month for each assignment group, but with the same line chart.


I've been thinking of a new measure to calculate Ticket age per month?


Any help appreciated.

1 ACCEPTED SOLUTION
v-yalanwu-msft
Community Support
Community Support

Hi, @PCahill19 ;

You could unpovit it in power query .

1. unpovit it.

vyalanwumsft_0-1658819138739.png

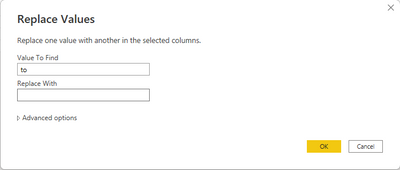
2.replace "to " to ""

vyalanwumsft_2-1658819331692.png


3.split column.

vyalanwumsft_1-1658819253679.png

4.remove columns.

vyalanwumsft_3-1658819414062.png
The final show:

vyalanwumsft_4-1658819474803.png

Then create a measure by dax.

aver = DIVIDE(SUM([Value]),CALCULATE(COUNT('Table'[Month]),'Table'[Value]<>0))

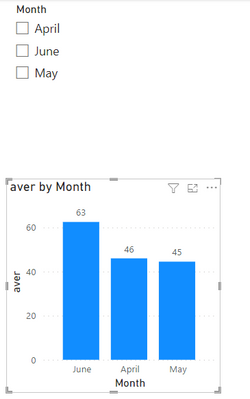
The final show:

vyalanwumsft_5-1658819701554.png


Best Regards,
Community Support Team _ Yalan Wu
If this post helps, then please consider Accept it as the solution to help the other members find it more quickly.

View solution in original post

4 REPLIES 4
v-yalanwu-msft
Community Support
Community Support

Hi, @PCahill19 ;

You could unpovit it in power query .

1. unpovit it.

vyalanwumsft_0-1658819138739.png

2.replace "to " to ""

vyalanwumsft_2-1658819331692.png


3.split column.

vyalanwumsft_1-1658819253679.png

4.remove columns.

vyalanwumsft_3-1658819414062.png
The final show:

vyalanwumsft_4-1658819474803.png

Then create a measure by dax.

aver = DIVIDE(SUM([Value]),CALCULATE(COUNT('Table'[Month]),'Table'[Value]<>0))

The final show:

vyalanwumsft_5-1658819701554.png


Best Regards,
Community Support Team _ Yalan Wu
If this post helps, then please consider Accept it as the solution to help the other members find it more quickly.

Thank you. This has worked.

PCahill19
Frequent Visitor

Thank you. I will try this later today.

Anonymous
Not applicable

Hello,


If you have yet to you should create a calendar table and link it to your dtata table. Then you can add the average age measure and seperate it per month.

Helpful resources

Announcements
April Power BI Update Carousel

Power BI Monthly Update - April 2026

Check out the April 2026 Power BI update to learn about new features.

Fabric SQL PBI Data Days

Data Days 2026 coming soon!

Sign up to receive a private message when registration opens and key events begin.

New to Fabric survey Carousel

New to Fabric Survey

If you have recently started exploring Fabric, we'd love to hear how it's going. Your feedback can help with product improvements.

Power BI DataViz World Championships carousel

Power BI DataViz World Championships - June 2026

A new Power BI DataViz World Championship is coming this June! Don't miss out on submitting your entry.