Fabric Data Days starts November 4th!
Advance your Data & AI career with 50 days of live learning, dataviz contests, hands-on challenges, study groups & certifications and more!
Get registered- Power BI forums
- Get Help with Power BI
- Desktop
- Service
- Report Server
- Power Query
- Mobile Apps
- Developer
- DAX Commands and Tips
- Custom Visuals Development Discussion
- Health and Life Sciences
- Power BI Spanish forums
- Translated Spanish Desktop
- Training and Consulting
- Instructor Led Training
- Dashboard in a Day for Women, by Women
- Galleries
- Data Stories Gallery
- Themes Gallery
- Contests Gallery
- QuickViz Gallery
- Quick Measures Gallery
- Visual Calculations Gallery
- Notebook Gallery
- Translytical Task Flow Gallery
- TMDL Gallery
- R Script Showcase
- Webinars and Video Gallery
- Ideas
- Custom Visuals Ideas (read-only)
- Issues
- Issues
- Events
- Upcoming Events
Get Fabric Certified for FREE during Fabric Data Days. Don't miss your chance! Request now
- Power BI forums
- Forums
- Get Help with Power BI
- Desktop
- Re: Adding conditional formatting to a matrix.
- Subscribe to RSS Feed
- Mark Topic as New
- Mark Topic as Read
- Float this Topic for Current User
- Bookmark
- Subscribe
- Printer Friendly Page


- Mark as New
- Bookmark
- Subscribe
- Mute
- Subscribe to RSS Feed
- Permalink
- Report Inappropriate Content
Adding conditional formatting to a matrix.
Hello,
I am trying to add the green checkmarks and red x’s like below to my Power BI matrix. I grouped the Loan Credit Score column into the 3 groups, but cannot figure out how to assign the checkmarks and x’s by the groupings. I do not need the groupings; I just couldn’t figure out how to do this.
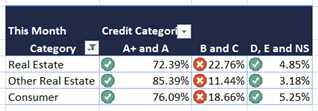
The conditions for a green checkmark are by Credit Score:
- A+ and A: >= 50%
- B and C: 30%-40%
- D, E AND No Score: <= 20%
The .pbix and spreadsheets for data are here:
https://drive.google.com/drive/folders/1FgxlBg_464T2SBkGK5yF8slhwMaclTPU?usp=sharing
Thank you.
Solved! Go to Solution.


- Mark as New
- Bookmark
- Subscribe
- Mute
- Subscribe to RSS Feed
- Permalink
- Report Inappropriate Content
Hey @jamoroso ,
this measure is almost creating what you are looking for:
vizAid Icon =
var currentValue = [Originations]
var currentColumnContext = SELECTEDVALUE( 'Loans'[LoanCreditScore (groups)] )
var greencheckmark = "CircleSymbolHigh"
var redCircle = "CircleSymbolLow"
return
SWITCH( currentColumnContext
    , "A+ & A"
        , var upperbound = 0.5
        return
        IF( currentValue >= upperbound
            , greencheckmark
            , redCircle
        )
    , "B & C"
        , var upperbound = 0.4
        var lowerbound = 0.3
        return
        IF( currentValue >= lowerbound && currentValue <= upperbound
            , greencheckmark
            , redCircle
        )
    , "D & E & No Score"
        , var upperbound = 0.2
        return
        IF( currentValue <= upperbound
            , greencheckmark
            , redCircle
        )
)
Here is the matrix visual after I added the measure to the Cell elements for the Icon formatting:
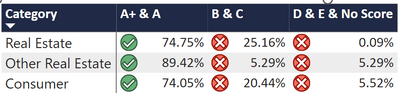
You have to adjust the lowerbound and upperbound values though.
This approach is based on a measure that returns an icon. I'm using two of the default icocns, if you want to use exactly the icons from your example, then you have to add the icons.
Here you will find an explanation of how to create measures that return icons: https://radacad.com/power-bi-icon-names-for-conditional-formatting-using-dax
And this video explains how to add custom icons/KPIs based on svg images: https://www.youtube.com/watch?v=z7eyZM2b4Z8
Hopefully, this helps what you are looking for.
Regards,
Tom
Did I answer your question? Mark my post as a solution, this will help others!
Proud to be a Super User!
I accept Kudos 😉
Hamburg, Germany
- Mark as New
- Bookmark
- Subscribe
- Mute
- Subscribe to RSS Feed
- Permalink
- Report Inappropriate Content
Hey @jamoroso ,
this measure is almost creating what you are looking for:
vizAid Icon =
var currentValue = [Originations]
var currentColumnContext = SELECTEDVALUE( 'Loans'[LoanCreditScore (groups)] )
var greencheckmark = "CircleSymbolHigh"
var redCircle = "CircleSymbolLow"
return
SWITCH( currentColumnContext
    , "A+ & A"
        , var upperbound = 0.5
        return
        IF( currentValue >= upperbound
            , greencheckmark
            , redCircle
        )
    , "B & C"
        , var upperbound = 0.4
        var lowerbound = 0.3
        return
        IF( currentValue >= lowerbound && currentValue <= upperbound
            , greencheckmark
            , redCircle
        )
    , "D & E & No Score"
        , var upperbound = 0.2
        return
        IF( currentValue <= upperbound
            , greencheckmark
            , redCircle
        )
)
Here is the matrix visual after I added the measure to the Cell elements for the Icon formatting:
You have to adjust the lowerbound and upperbound values though.
This approach is based on a measure that returns an icon. I'm using two of the default icocns, if you want to use exactly the icons from your example, then you have to add the icons.
Here you will find an explanation of how to create measures that return icons: https://radacad.com/power-bi-icon-names-for-conditional-formatting-using-dax
And this video explains how to add custom icons/KPIs based on svg images: https://www.youtube.com/watch?v=z7eyZM2b4Z8
Hopefully, this helps what you are looking for.
Regards,
Tom
Did I answer your question? Mark my post as a solution, this will help others!
Proud to be a Super User!
I accept Kudos 😉
Hamburg, Germany
- Mark as New
- Bookmark
- Subscribe
- Mute
- Subscribe to RSS Feed
- Permalink
- Report Inappropriate Content
Hey @jamoroso ,
in this video
https://www.youtube.com/watch?v=UCLCQaVeshs
Reza explains how you can use icons in combination with a DAX measure, this is necessary because of the different columns have different boundaries.
Hopefully, this helps to tackle your.
Regards,
Tom
Did I answer your question? Mark my post as a solution, this will help others!
Proud to be a Super User!
I accept Kudos 😉
Hamburg, Germany
- Mark as New
- Bookmark
- Subscribe
- Mute
- Subscribe to RSS Feed
- Permalink
- Report Inappropriate Content
Hi @TomMartens ,
Thanks for the reply, but unfortunately this does not solve my issue. My columns are actually one column broken into Groups, so I do not have 3 separate columns to apply the different formatting to. I am an occasional Power BI user and this is beyond my basic knowledge. Maybe I should not have broken it into Groups? I need 3 separate columns based on the values in the Loan Credit Score field and then need to format each column based on a different set of rules.
Thanks,
Janet
- Mark as New
- Bookmark
- Subscribe
- Mute
- Subscribe to RSS Feed
- Permalink
- Report Inappropriate Content
Hey @jamoroso ,
it was a good idea to group values using a "new" column in the same table, basically this is how dimensional modeling works.
Consider uploading your pbix and the spreadsheets to one of the larger file shares like onedrive, googledrive, or dropbox and share the link. Make sure that we can download the files w/o to login.
Regards,
Tom
Did I answer your question? Mark my post as a solution, this will help others!
Proud to be a Super User!
I accept Kudos 😉
Hamburg, Germany
- Mark as New
- Bookmark
- Subscribe
- Mute
- Subscribe to RSS Feed
- Permalink
- Report Inappropriate Content
I did upload my report and spreadsheets to WeTransfer. I put that in my original post. Did I do it wrong? This is the link. https://we.tl/t-SgRTAjKx9w
- Mark as New
- Bookmark
- Subscribe
- Mute
- Subscribe to RSS Feed
- Permalink
- Report Inappropriate Content
Hey @jamoroso , you did not, but I do not download from any other cloudstore I mentioned in my post above. One of the reason: https://www.google.com/search?q=wetransfer+malware&rlz=1C5CHFA_enDE1061DE1061&oq=wetransfer+malware&...
Regards,
Tom
Did I answer your question? Mark my post as a solution, this will help others!
Proud to be a Super User!
I accept Kudos 😉
Hamburg, Germany
- Mark as New
- Bookmark
- Subscribe
- Mute
- Subscribe to RSS Feed
- Permalink
- Report Inappropriate Content

Helpful resources

Fabric Data Days
Advance your Data & AI career with 50 days of live learning, contests, hands-on challenges, study groups & certifications and more!

Power BI Monthly Update - October 2025
Check out the October 2025 Power BI update to learn about new features.

FabCon Atlanta 2026
Join us at FabCon Atlanta, March 16-20, for the ultimate Fabric, Power BI, AI and SQL community-led event. Save $200 with code FABCOMM.


