Fabric Data Days starts November 4th!
Advance your Data & AI career with 50 days of live learning, dataviz contests, hands-on challenges, study groups & certifications and more!
Get registered- Power BI forums
- Get Help with Power BI
- Desktop
- Service
- Report Server
- Power Query
- Mobile Apps
- Developer
- DAX Commands and Tips
- Custom Visuals Development Discussion
- Health and Life Sciences
- Power BI Spanish forums
- Translated Spanish Desktop
- Training and Consulting
- Instructor Led Training
- Dashboard in a Day for Women, by Women
- Galleries
- Data Stories Gallery
- Themes Gallery
- Contests Gallery
- QuickViz Gallery
- Quick Measures Gallery
- Visual Calculations Gallery
- Notebook Gallery
- Translytical Task Flow Gallery
- TMDL Gallery
- R Script Showcase
- Webinars and Video Gallery
- Ideas
- Custom Visuals Ideas (read-only)
- Issues
- Issues
- Events
- Upcoming Events
Get Fabric Certified for FREE during Fabric Data Days. Don't miss your chance! Request now
- Power BI forums
- Forums
- Get Help with Power BI
- Desktop
- 2 linked tables with different reference dates, ne...
- Subscribe to RSS Feed
- Mark Topic as New
- Mark Topic as Read
- Float this Topic for Current User
- Bookmark
- Subscribe
- Printer Friendly Page


- Mark as New
- Bookmark
- Subscribe
- Mute
- Subscribe to RSS Feed
- Permalink
- Report Inappropriate Content
2 linked tables with different reference dates, need to present on same axis
Hi,
I have 2 tables, Orders and Deliveries. I need to create a table that lists the number of orders and deliveries by month. I’m confused because I can only use 1 column as an axis but I have 2 date columns (one in the Orders table and one in the Deliveries table). The tables are linked but I can’t just use the Order date as the axis because this will just list all deliveries by their order date (not their delivery date).
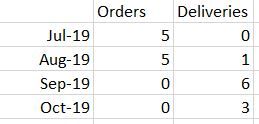
Please can you tell me how to create a table as per the last screenshot below?
Orders table:
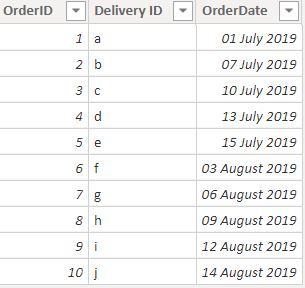
Deliveries table:
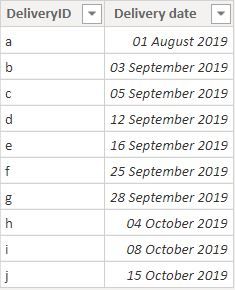
Relationships (I tried to create a common calendar but I can't make both date relationships active)
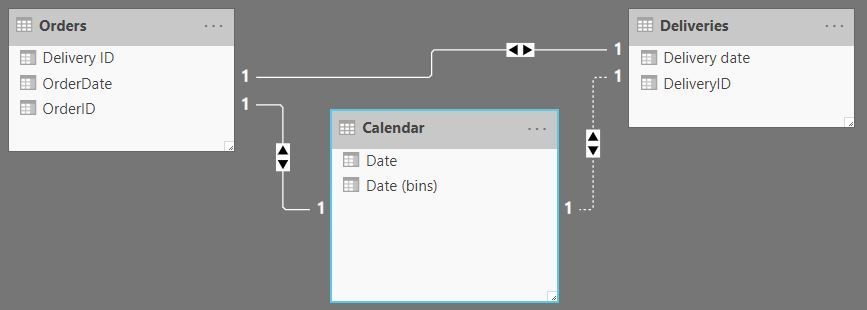
Current output (incorrect because deliveries are being mapped by the order date):
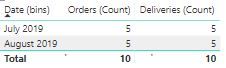
Target output (orders mapped by order date, deliveries mapped by delivery date - and both on the same month axis). Please can you tell me how to create this table in Power BI?
Thank you for your help!
CM


- Mark as New
- Bookmark
- Subscribe
- Mute
- Subscribe to RSS Feed
- Permalink
- Report Inappropriate Content
Hi @CloudMonkey
If you've fixed the issue by your own please kindly share your solution. if the above posts help, please kindly mark it as a solution to help others find it more quickly. thanks!
If this post helps, then please consider Accept it as the solution to help the other members find it more
quickly.


- Mark as New
- Bookmark
- Subscribe
- Mute
- Subscribe to RSS Feed
- Permalink
- Report Inappropriate Content
Hi,
There should not be a relationship between the Order and Deliveries Table. There should just be 2 active relatinships - From Date column of Orders Table to the Date column of the Calendar Table and from the Date column of the Deliveries Table to the Date column of the Calendar Table. To your visual, drag dates from the Calendar Table and write these measures:
Measue1 = COUNTA('Orders'[Delivery ID])
Measure2 = COUNTA(Deliveries'[Delivery ID])
Hope this helps.
Regards,
Ashish Mathur
http://www.ashishmathur.com
https://www.linkedin.com/in/excelenthusiasts/

- Mark as New
- Bookmark
- Subscribe
- Mute
- Subscribe to RSS Feed
- Permalink
- Report Inappropriate Content
@CloudMonkeyI may have what you need.
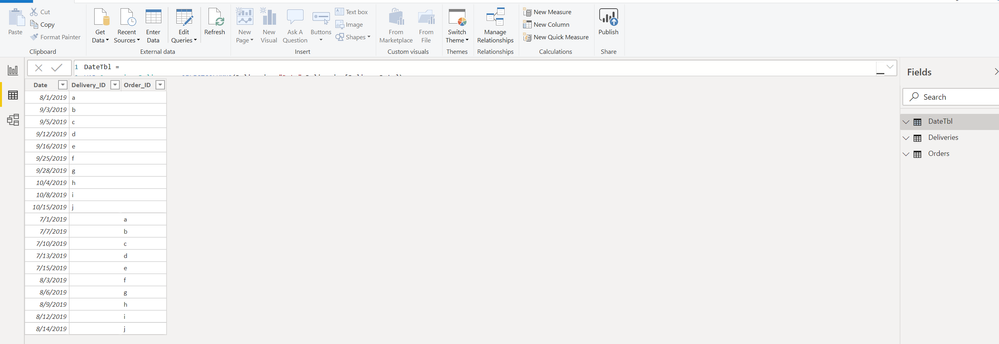
From Orders_table and Deliveries Table I created a following table called
DateTbl =
VAR Summarize_Delivery = SELECTCOLUMNS(Deliveries,"Date",Deliveries[DeliveryDate])
VAR Summarize_Orders = SELECTCOLUMNS(Orders,"Date",Orders[OrderDate])
VAR Union_All=Union(Summarize_Delivery,Summarize_Orders)
RETURN
Union_All
Delivery_ID = LOOKUPVALUE(Deliveries[DeliveryID],Deliveries[DeliveryDate],DateTbl[Date])
Order_ID = LOOKUPVALUE(Orders[DeliveryID],Orders[OrderDate],DateTbl[Date])
create Measures as following
Delivery_Count = COUNT(DateTbl[Delivery_ID])
Order_Count = COUNT(DateTbl[Order_ID])
resulting table as following
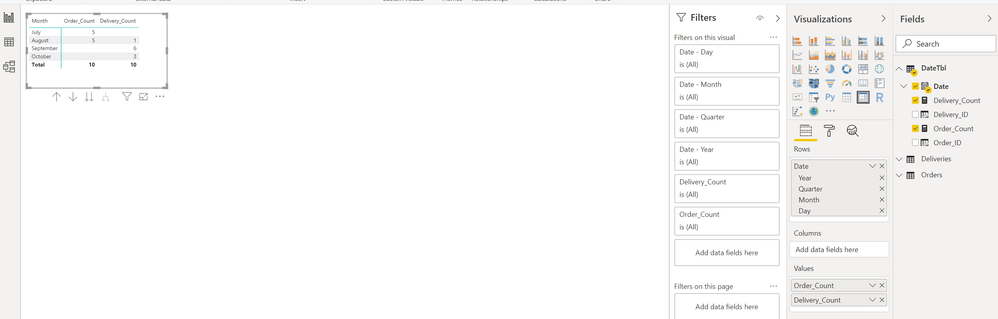
Now when you plot

- Mark as New
- Bookmark
- Subscribe
- Mute
- Subscribe to RSS Feed
- Permalink
- Report Inappropriate Content
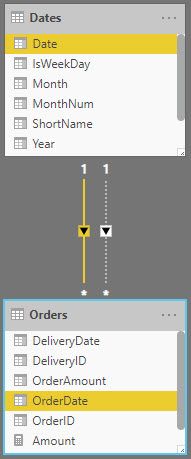
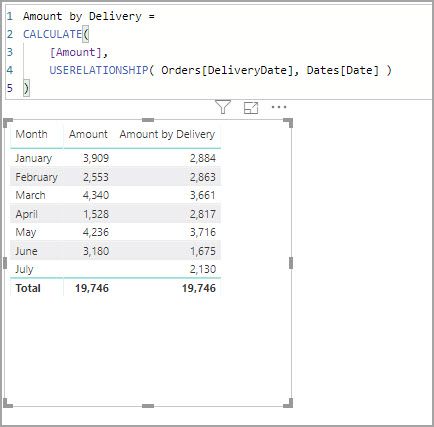
One thing you could do is move the delivery date to the orders table. Then you link both date fields to your dates table and invoke the second relationship when needed. In the image blow the inactive (dotted line) relationship is between 'Dates'[Date] and 'Orders'[DeliveryDate]
Then a couple of example measures to show how the relationships are used.
Amount = SUM ( Orders[OrderAmount] )
Amount by Delivery =
CALCULATE(
    [Amount],
    USERELATIONSHIP( Orders[DeliveryDate], Dates[Date] )
)
I have attached my sample file for you to look at.


- Mark as New
- Bookmark
- Subscribe
- Mute
- Subscribe to RSS Feed
- Permalink
- Report Inappropriate Content
Hi @CloudMonkey
Your relationship could be a problem.
Connect Orders table to Calendar table and Delivery table to Calendar table. No Relationship needed between Orders table and Deliveries table.
Once the relationship is complete, now Pull the Date from Calendars table, and the respective fields from Orders and Delivery table can be dragged to this table.
Hope this solves your problem!
If I have answered your question then please do mark this as a solution.
Regards,
Pradip Microsoft Certified Trainer
- Mark as New
- Bookmark
- Subscribe
- Mute
- Subscribe to RSS Feed
- Permalink
- Report Inappropriate Content
Thanks guys but I think I need to keep the link between Orders and Deliveries because that database structure will be needed later on for other analysis. I tried the below approach, what do you think? Is it good database structure (I'm not very experienced so am concerned about making mistakes that will make life harder later!)?


Many thanks for your help!
CM
- Mark as New
- Bookmark
- Subscribe
- Mute
- Subscribe to RSS Feed
- Permalink
- Report Inappropriate Content
Hi @CloudMonkey ,
The solution given by @Anonymous and I are the ideal way to link the data base to the calendar table. It will be more helpful to use time intelligence functions here.
You can get the report that you want in the relationship solutions given earlier. What you have used wont be a good data base architecture.
Regards,
Pradip Microsoft Certified Trainer
- Mark as New
- Bookmark
- Subscribe
- Mute
- Subscribe to RSS Feed
- Permalink
- Report Inappropriate Content
Hi @CloudMonkey,
Ideally, there should not be any relationships between your fact tables (Orders and Delivery in your scenario).
The data model should ideally be a Star schema or snow flake schema.
Thanks.

- Mark as New
- Bookmark
- Subscribe
- Mute
- Subscribe to RSS Feed
- Permalink
- Report Inappropriate Content
Hi,
Here's what you need to do:th
1. Create a Calendar dimension and join the table Orders and Delivery to it.
2. Remove the relationship between Orders and Delivery table.
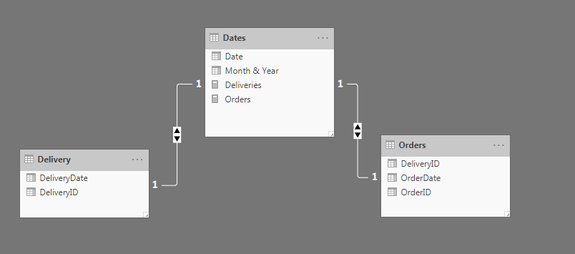
3. Create 2 measures as below:
Deliveries = COUNTROWS( Delivery )
Orders = COUNTROWS( Orders )
4. Create a matrix visual and drag these 2 measures against dates:

Thanks.
Helpful resources

Fabric Data Days
Advance your Data & AI career with 50 days of live learning, contests, hands-on challenges, study groups & certifications and more!

Power BI Monthly Update - October 2025
Check out the October 2025 Power BI update to learn about new features.

FabCon Atlanta 2026
Join us at FabCon Atlanta, March 16-20, for the ultimate Fabric, Power BI, AI and SQL community-led event. Save $200 with code FABCOMM.


