- Power BI forums
- Updates
- News & Announcements
- Get Help with Power BI
- Desktop
- Service
- Report Server
- Power Query
- Mobile Apps
- Developer
- DAX Commands and Tips
- Custom Visuals Development Discussion
- Health and Life Sciences
- Power BI Spanish forums
- Translated Spanish Desktop
- Power Platform Integration - Better Together!
- Power Platform Integrations (Read-only)
- Power Platform and Dynamics 365 Integrations (Read-only)
- Training and Consulting
- Instructor Led Training
- Dashboard in a Day for Women, by Women
- Galleries
- Community Connections & How-To Videos
- COVID-19 Data Stories Gallery
- Themes Gallery
- Data Stories Gallery
- R Script Showcase
- Webinars and Video Gallery
- Quick Measures Gallery
- 2021 MSBizAppsSummit Gallery
- 2020 MSBizAppsSummit Gallery
- 2019 MSBizAppsSummit Gallery
- Events
- Ideas
- Custom Visuals Ideas
- Issues
- Issues
- Events
- Upcoming Events
- Community Blog
- Power BI Community Blog
- Custom Visuals Community Blog
- Community Support
- Community Accounts & Registration
- Using the Community
- Community Feedback
Register now to learn Fabric in free live sessions led by the best Microsoft experts. From Apr 16 to May 9, in English and Spanish.
- Power BI forums
- Galleries
- Data Stories Gallery
- Visualize Gender Equality: Operation Obstetrics Fi...
Visualize Gender Equality: Operation Obstetrics Fistula Analysis
05-22-2021 06:51 AM


- Mark as New
- Bookmark
- Subscribe
- Mute
- Subscribe to RSS Feed
- Permalink
- Report Inappropriate Content
Visualize Gender Equality: Operation Obstetrics Fistula Analysis
According to Dr. Natalia Kanem, Obstetric Fistula is a childbirth injury caused by prolonged, obstructed labor without prompt medical attention. This condition is silently robbing millions of women and girls of their health, hope and dignity, said Dr. Natalia Kanem.
We define the obstetric fistula in Operation Fistula as the worst thing you’ve ever heard of. When women undergo prolonged, obstructed labor without recourse to emergency interventions, the pain of labor, such as a cesarean section, causes a hole to form between the **bleep** and Rectum or intestine.
Fistula surgeons worldwide, however, are limited in the amount of maintenance they will perform, as they are unable to obtain the funds they need to provide care. This problem, this barrier to treatment, was one of the first to be broken down by Operation Fistula in the work to end fistula.
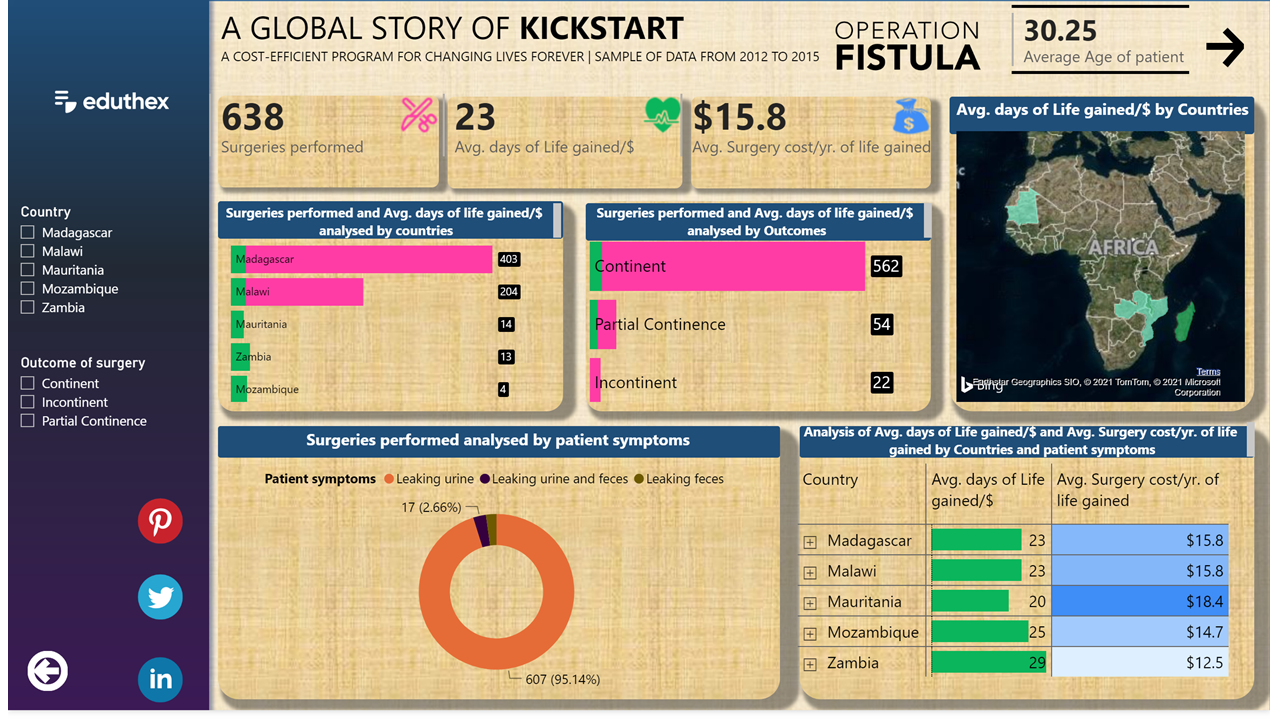
This Power BI dashboard is to help Operation Fistula in raising funds for their new performance based funding program. The data used in building this dashboard came from the Operation Fistula’s Pilot Program, 2012-2015.
For those seeking to end the oppression of gender discrimination, this dashboard built with Power BI will serve as lobbying instruments, awareness-raising objects, and data-driven knowledge vehicles.
eyJrIjoiMTc4YmU0NzktZjRlOS00OWYxLWJhZTMtNTgzN2YzZTlkNWM3IiwidCI6ImMwODg5MDgwLTg5YTAtNDU2NC04NjU4LWNjMTU0ZDYzZTdmNCJ9&pageName=ReportSection631a6fc24d9b4901940d